PRICE BOOK VALUE MULTIPLES
General Issues in estimating and using price-book value ratios
Measurement
The book value of equity is the difference between the book value of assets and the book value of liabilities.
The measurement of the book value of assets is largely determined by accounting convention.
Book Value versus Market Value
The market value of an asset reflects its earning power and expected cashflows.
Since the book value of an asset reflects its original cost, it might deviate significantly from market value if the earning power of the asset has increased or declined significantly since its acquisition.
Advantages of using price/book value ratios
It provides a relatively stable, intuitive measure of value which can be compared to the market price.
Given reasonably consistent accounting standards across firms, price-book value ratios can be compared across similar firms for signs of under or over valuation.
Even firms with negative earnings, which cannot be valued using PE ratios, can be evaluated using price-book value ratios.
Disadvantages of using price-book value ratios
Book values, like earnings, are affected by accounting decisions on depreciation and other variables. When accounting standards vary widely across firms, the price-book value ratios may not be comparable across firms.
Book value may not carry much meaning for service firms which do not have significant fixed assets.
The book value of equity can become negative if a firm has a sustained string of negative earnings reports, leading to a negative price-book value ratio.
Estimating price-book value ratios from fundamentals
PBV Ratio for a stable firm
The value of equity for a stable firm, using the Gordon growth model is:
![]()
Defining the return on equity (ROE) = EPS0 / Book Value of Equity, the value of equity can be written as:


If the return on equity is based upon expected earnings in the next time period, this can be simplified to,

A Formulation based upon differential returns
This formulation can be simplified even further by relating growth to the return on equity:
g = (1 - Payout ratio) * ROE
Substituting back into the P/BV equation,
![]()
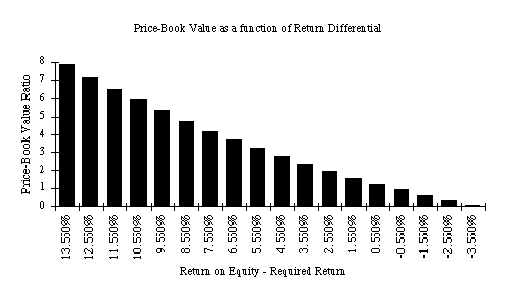
The price-book value ratio of a stable firm is determined by the differential between the return on equity and the required rate of return on its projects.
Illustration 13: Estimating the PBV ratio for a stable firm with
dividends- Amoco
Amoco had earnings per share of $3.82 in 1994, and paid out 60%
of its earnings as dividends that year. The growth rate in earnings
and dividends, in the long term, is expected to be 6%. The return
on equity at Amoco in 1994 was 15%. The beta for Amoco is 0.65
and the treasury bond rate is 7.5%.
Current Dividend Payout Ratio = 60%
Expected Growth Rate in Earnings and Dividends = 6%
Return on Equity =15%
Cost of Equity = 7.5% + 0.65*5.5% = 11.08 %
P/BV and ROE for Oil Companies - 1995
|
|
|
|
|
|
| Elf Aquitane |
|
|
|
|
| Amerada Hess |
|
|
|
|
| Getty |
|
|
|
|
| Murphy Oil |
|
|
|
|
| Ashland Oil |
|
|
|
|
| Repsol |
|
|
|
|
| Royal Dutch |
|
|
|
|
| Texaco |
|
|
|
|
| Occidental Pete |
|
|
|
|
| Mobil |
|
|
|
|
| Chevron Corp |
|
|
|
|
| Amoco |
|
|
|
|
| Exxon Corp |
|
|
|
|
| British Petroleum |
|
|
|
|
| Unocal |
|
|
|
|
| Atlantic Richfield |
|
|
|
OIL COMPANIES: P/BV AND ROE
Valuing a Privatization Candidate (Oil)
Assume that you have been asked to value a PEMEX for the Mexican
Government; All you know is that it has earned a return on equity
of 14% last year. The appropriate P/BV ratio can be estimated
in one of two ways ñ
Beta based upon international oil companies = 0.70
Cost of Equity = 7.50% + 0.70 (5.50%) = 11.35%
P/BV Ratio (based upon fundamentals) = (0.14 - 0.06) / (.1135
- 0.06) = 1.50
P/BV Ratio (based upon regression) = 0.91 + 8.26 * 0.14 = 2.07
Jenapharm was the most respected pharmaceutical manufacturer in East Germany.
Jenapharm, which was expected to have revenues of 230 million DM in 1991, also was expected to make earnings before interest and taxes of 30 million DM.
The firm had a book value of assets of 110 million DM, and a book value of equity of 58 million DM. The interest expenses in 1990 amounted to 15 million DM.
The firm was expected to maintain sales in its niche product, a contraceptive pill, and grow at 5% a year in the long term, primarily by expanding into the generic drug market.
The average beta of pharmaceutical firms traded on the Frankfurt Stock exchange wass 1.05, though many of these firms had much more diversified product portfolios and less volatile cashflows.
Allowing for the higher leverage and risk in Jenapharm, a beta of 1.25 was used for Jenapharm. The ten-year bond rate in Germany at the time of this valuation was 7%, and the risk premium for stocks over bonds is assumed to be 3.5%.
Valuing Jenapharm
Expected Net Income = (EBIT - Interest Expense)*(1-t) = (30 -
15) *(1-0.4) = 9 mil DM
Return on Equity = Expected Net Income / Book Value of Equity
= 9 / 58 = 15.52%
Cost on Equity = 7% + 1.25 (3.5%) = 11.375%
Price/Book Value Ratio = (ROE - g) / (r - g) = (.1552 - .05) /
(.11375 - .05) = 1.65
Estimated MV of equity = BV of Equity * Price/BV ratio = 58 *
1.65 = 95.70 mil DM
PBV Ratio for a high growth firm
When the growth rate is assumed to be constant after the initial high growth phase, the dividend discount model can be written as follows:

Rewriting EPS0 in terms of the return on equity, EPS0 = BV0*ROE, and bringing BV0 to the left hand side of the equation, we get

Illustration 15: Estimating the PBV ratio for a high growth firm
in the two-stage model
Assume that you have been asked to estimate the PBV ratio for
a firm which has the following characteristics:
Growth rate in first five years = 20% Payout ratio in first five
years = 20%
Growth rate after five years = 8% Payout ratio after five years
= 68%
Beta = 1.0 Riskfree rate = T.Bond Rate = 6%
Return on equity = 25%
Required rate of return = 6% + 1(5.5%)= 11.5%

The estimated PBV ratio for this firm is 7.89.
Illustration 16: Estimating the Price/Book Value Ratio for a high
growth firm - Bertelsmann AG
Bertelsmann AG is a German publishing company which is involved
in a wide range of media.
High Growth Period Stable Growth Period
Expected length = 10 years Growth Rate = 6%
Growth Rate = 20% Payout Ratio = 60%
Payout Ratio = 30% Return on Equity = 15%
Return on Equity = 28.57%
Beta in both periods is 0.90. The German long bond rate was approximately
7.50%.
Note: Expected Growth Rate = (1 - Payout Ratio) (ROE)
Cost of Equity = 7.50% + 0.90 * 5.5% = 12.45 %

PBV Ratios and Return on Equity
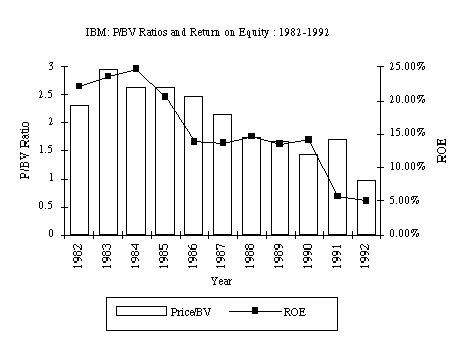
The ratio of price to book value is strongly influenced by the return on equity.
A lower return on equity affects the price-book value ratio directly through the formulation specified in the prior section and
indirectly, by lowering the expected growth or payout.
Expected growth rate = Retention Ratio * Return on Equity
Illustration 17: Return on Equity and Price-Book Value
Assume that a firm has the following characteristics:
Return on Equity = 25%
Growth rate in first five years= 20% Payout ratio in first five
years =20%
Growth rate after five years = 8% Payout ratio after five years
= 68 %
Beta = 1.0 Required rate of return = 11.5%
Note that the growth rate in first five years = Retention ratio
* ROE = 0.8 * 25% = 20%
and the growth rate after year 5 = Retention ratio * ROE = 0.32
* 25% = 8%

Effect of a Drop in the ROE
If the firm's return on equity drops to 12%, the price/book value
will reflect the drop. The lower return on equity will also lower
expected growth in the initial high growth period:
Expected growth rate (first five years) = Retention ratio * Return
on Equity
= 0.80* 12% = 9.6%
After year 5, either the retention ratio has to increase or the
expected growth rate has to be lower than 8%. If the retention
ratio is adjusted,
New retention ratio after year 5 = Expected growth / ROE = 8%/12%
= 66.67%
New payout ratio after year 5 = 1 - Retention ratio = 33.33%
The new price-book value ratio can then be calculated as follows:

The drop in the ROE has a two-layered impact. First, it lowers the growth rate in earnings and/or the expected payout ratio, thus having an indirect effect on the P/BV ratio. Second, it reduces the P/BV ratio directly.

Note that when the return on equity is equal to the required return,
the price is equal to the book value.

Looking for undervalued securities - PBV Ratios and ROE

A Simple Control for ROE ñ PBV / ROE
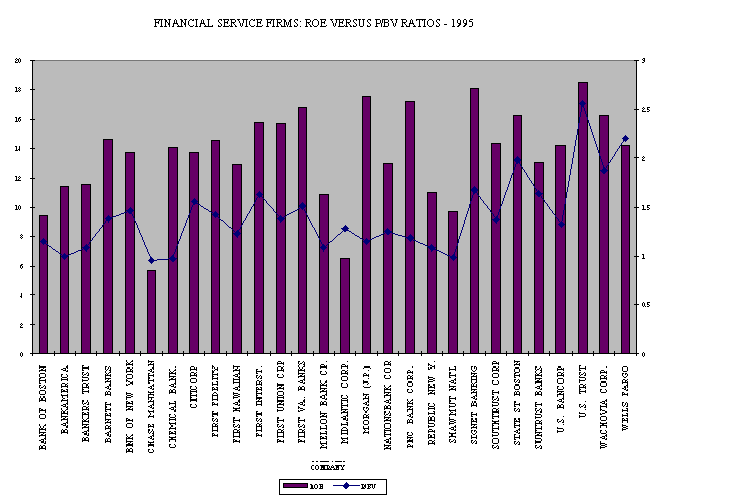
A simple way of controlling for differences in Return on Equity is to calculate the ratio of P/BV ratios to return on equity, and ranking firms on that basis. Using that approach, the financial service firms which had the lowest PBV/ROE ratios were ñ
|
|
|
||||||
| Company Name |
|
|
|
Company Name |
|
|
|
| MIDLANTIC CORP. |
|
|
|
MORGAN (J.P.) |
|
|
|
| CHASE |
|
|
|
PNC BANK CORP. |
|
|
|
| WELLS FARGO |
|
|
|
CHEMICAL BANK. |
|
|
|
| U.S. TRUST |
|
|
|
BANKAMERICA |
|
|
|
| SUNTRUST BANKS |
|
|
|
FIRST UNION CRP |
|
|
|
Estimating price-book value ratios from comparables
Year Regression R squared
1987 PBV = 0.1841 + .00200 PAYOUT - 0.3940 BETA + 1.3389 EGR +
9.35 ROE 0.8617
1988 PBV = 0.7113 + 0.00007 PAYOUT - 0.5082 BETA + 0.4605 EGR
+ 6.9374 ROE 0.8405
1989 PBV = 0.4119 + 0.0063 PAYOUT - 0.6406 BETA + 1.0038 EGR+
9.55 ROE 0.8851
1990 PBV = 0.8124 + 0.0099 PAYOUT - 0.1857 BETA + 1.1130 EGR+
6.61 ROE 0.8846
1991 PBV =1.1065 + 0.3505 PAYOUT - 0.6471 BETA + 1.0087 EGR +
10.51 ROE 0.8601
where,
PBV = Price / Book Value Ratio at the end of the year PAYOUT =
Dividend Payout ratio at end of the year
BETA = Beta of the stock EGR = Growth rate in earnings over prior
five years
ROE = Return on Equity = Net Income / Book Value of Equity
1995 Regression: PBV = 0.4138 + 0.3194 PAYOUT - 0.3418 BETA +
0.3549 EGR+ 14.75 ROE R2=0.7726
EGR = Expected earnings growth rate over next five years
Illustration 19 : Valuing aan initial public offering using the
cross-sectional regression
Assume that you had been asked to value Semitool, a company which
manufactures equipment used in the fabrication of semiconductors
early in 1995 and that you had obtained the following data on
the company:
Book Value of Equity = $ 29.60 million
Net Income in 1994 = $3.60 million
Beta based upon comparable firms = 1.40 (This is the average beta
for comparable firms)
Free Cash Flow to Equity in 1994 = - 2.50 million
Expected growth rate over next five years = 20%
First compute the variables in the desired units,
Payout = 0% (Assume that this company will not pay dividends)
Earnings Growth Rate = 20%
Return on Equity = 3.60/29.60 = 12.16% Beta = 1.40
Predicted PBV Ratio = 0.4138 + 0.3194(0) - 0.3418 (1.40) + 0.3549
(.20)+ 14.75 (.1216) = 1.80
Predicted Market Value of Equity in Semitool Inc. = 1.80 * $ 29.60
million= $53.28 million
Price-Book Value Ratios and Investment Strategies
Price-Book Value Ratios and Excess Returns