Gordon Growth Model: ![]()
PRICE EARNINGS MULTIPLES
Why is the PE ratio used so widely?
it an intuitively appealing statistic that relates the price paid to current earnings.
it is simple to compute for most stocks, and is widely available, making comparisons across stocks simple.
it is a proxy for a number of other characteristics of the firm including risk and growth.
Potential for misuse
use of PE ratios is a way, for some analysts, to avoid having to be explicit about their assumptions on risk, growth and payout ratios.
they are much more likely to reflect market moods and perceptions but this can be viewed as a weakness, especially when markets make systematic errors in valuing entire sectors.
Estimating PE ratios from fundamentals
PE Ratio for a stable firm
A stable firm is a firm growing at a rate comparable to the nominal growth rate in the economy in which it operates.
Gordon Growth Model: ![]()
where,
P0 = Value of equity DPS1 = Expected dividends per share next
year
r = Required rate of return on equity gn = Growth rate in dividends
(forever)
Substituting in for DPS1 = EPS0 (1+gn) (Payout ratio), the value of the equity can be written as:

Illustration 1: Estimating the PE ratio for a stable firm using
DPS- Deutsche Bank AG
Deutsche Bank had earnings per share of 46.38 DM in 1994, and
paid out 16.50 DM as dividends that year. The growth rate in earnings
and dividends, in the long term, is expected to be 6%. The beta
for Deutsche Bank is 0.92 and the long term bond rate in Germany
is 7.50%. (The premium used for German stocks is 4.5%.)
Current Dividend Payout Ratio = 16.50/46.38 = 35.58%
Expected Growth Rate in Earnings and Dividends = 6%
Cost of Equity =7.50 % + 0.92*4.5% = 11.64%
PE Ratio based on fundamentals = 0.3558 *1.06 / (.1164 -.06) =
6.69
Detusche Bank was selling at a PE ratio of 13.50 at the time of
this analysis. (May 1993)
Illustration 2: Estimating the PE ratio for a stable firm using
FCFE - Siemens AG
Siemens had earnings per share of 32.76 DM and paid dividends
per share of 13 DM in 1994. The beta for the stock is 0.93. The
ten-year bond rate in Germany was 7.5% and the risk premium for
stocks over bonds is assumed to be 4.50%. The company had FCFE
in 1994 of 20 DM per share
FCFE Payout Ratio = 61.05 %
Dividend Payout Ratio = 39.68%
Expected growth rate in earnings and dividends in long term =
6%
Cost of equity = 7.50% + 0.93 (4.50%) = 11.69 %
PE Ratio based upon fundamentals = 0.6105 * 1.06 / (.1169 - .06)
= 11.37
Siemens was selling at a price-earnings multiple of 16.68 in July
1993.
PE Ratio for a high growth firm
The price-earnings ratio for a high growth firm can also be related to fundamentals. In the special case of the two-stage dividend discount model, this relationship can be made explicit fairly simply:

where,
EPS0 = Earnings per share in year 0 (Current year) g = Growth
rate in the first n years
r = Required rate of return on equity Payout = Payout ratio in
the first n years
gn = Growth rate after n years forever (Stable growth rate) Payoutn
= Payout ratio after n years for the stable firm

Determinants of the PE ratio for a high growth firm
The left hand side of the equation is the price earnings ratio. It is determined by--
Payout ratio during the high growth period and in the stable period: The PE ratio increases as the payout ratio increases.
Riskiness (through the discount rate r): The PE ratio becomes lower as riskiness increases.
Expected growth rate in Earnings, in both the high growth and stable phases: The PE increases as the growth rate increases, in either period.
Illustration 3: Estimating the PE ratio for a high growth firm
in the two-stage model
Assume that you have been asked to estimate the PE ratio for a
firm which has the following characteristics:
Growth rate in first five years = 25% Payout ratio in first five
years = 20%
Growth rate after five years = 8% Payout ratio after five years
= 50%
Beta = 1.0 Riskfree rate = T.Bond Rate = 6%
Required rate of return = 6% + 1(5.5%)= 11.5%
The estimated PE ratio for this firm is 28.75.
Illustration 4: Estimating the PE ratio for Nike - 1994
The following is a estimation of the appropriate PE ratio for
Nike in March 1995. It is assumed to have five years of high growth
left, after which the firm is expected to be in steady state.
High Growth Period
Expected Return on Equity = 18% (This is slightly lower than the
ROE in 1994 of 19.5%)
Expected Payout Ratio = 20% (This is the current payout ratio)
Growth Rate in high growth period = (1 - Payout Ratio) ROE = (1-.2)
(.18) = 14.4%
Length of high growth period = 5 years
The beta of Nike currently is 1.45, and the treasury bond rate
is 7.5%, yielding a cost of equity of:
Cost of Equity = 7.5% + 1.45 * (5.5%) = 15.48 %
Stable Growth Period
Expected growth rate = 6%
The beta of Nike in stable growth is expected to be 1.10, leading
to a cost of equity of:
Cost of Equity = 7.5% + 1.10 * (5.5%) = 13.55 %
Expected Return on Equity = 15.00%
Expected Payout Ratio in stable phase = 1 - 6%/15% = 60%
The price-earnings ratio can be estimated based upon these inputs:

Nike was trading at a price-earnings ratio of 14 in March .1995.
These are Class B shares, with limited voting rights.
PE Ratios and Expected Extraordinary Growth
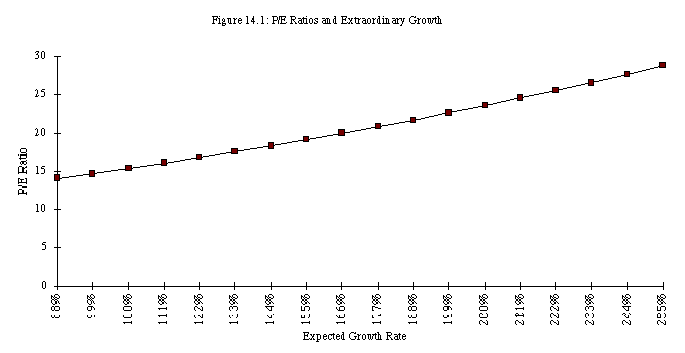
As the firm's anticipated extraordinary growth rate in the first
five years declines from 25% to 8%, the PE ratio for the firm
also decreases from 28.75 to 15.
Investment Strategies that compare PE to the expected growth rate
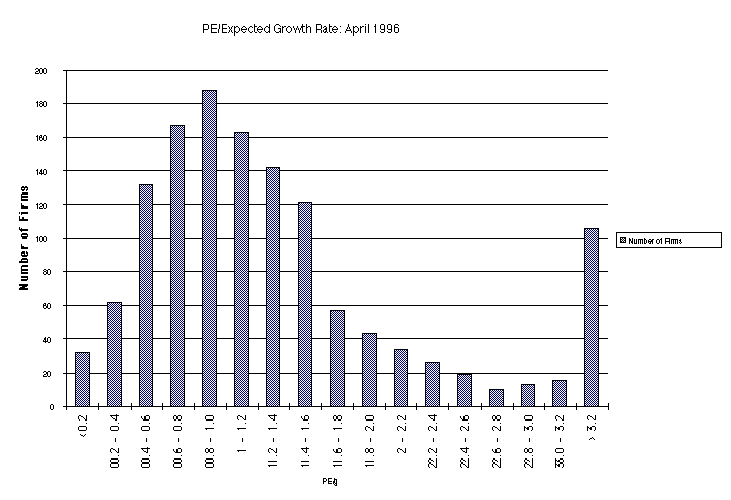
Portfolio managers and analysts sometimes compare PE ratios to the expected growth rate to identify under and overvalued stocks.
In the simplest form of this approach, firms with PE ratios less than their expected growth rate are viewed as undervalued.
In its more general form, the ratio of PE ratio to growth is used as a measure of relative value.
Problems with comparing PE ratios to expected growth
In its simple form, there is no basis for believing that a firm is undervalued just because it has a PE ratio less than expected growth.
This relationship may be consistent with a fairly valued or even an overvalued firm, if interest rates are high, or if a firm is high risk.
Problems with the relative comparison (PE/g)
In its relative form, where firms are ranked on the basis of the ratio of PE ratio to expected growth, the rankings will provide a measure of relative value if,
The length of the high growth period is the same for all firms
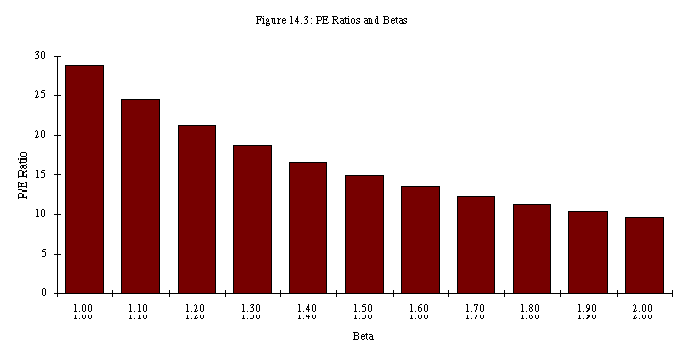
All firms are of equivalent risk. If the model used is the CAPM, all firms have the same betas.
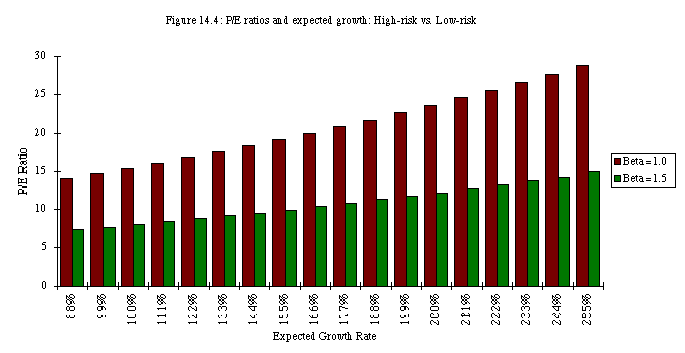
The PE ratio of the safer firm will be higher than the PE ratio
of the riskier firm at every level of growth, as illustrated in
figure 14.4:
Comparisons of PE Ratios
Comparisons across countries
Comparisons are often made between price-earnings ratios in different countries with the intention of finding undervalued and overvalued markets.
It is clearly misleading in these cases to compare PE ratios across different market without controlling for differences in the underlying variables.
AN EXAMPLE WITH EMERGING MARKETS
| Country |
|
|
|
|
| Peru |
|
|
|
|
| South Korea |
|
|
|
|
| Malaysia |
|
|
|
|
| Phillipines |
|
|
|
|
| India |
|
|
|
|
| Pakistan |
|
|
|
|
| Turkey |
|
|
|
|
| Thailand |
|
|
|
|
| Chile |
|
|
|
|
| Brazil |
|
|
|
|
| Argentina |
|
|
|
|
| Indonesia |
|
|
|
|
| Venezuela |
|
|
|
|
| Mexico |
|
|
|
|
| Hong Kong |
|
|
|
|
| Singapore |
|
|
|
|
The regression of PE ratios on these variables provides the following ñ
PE = 33.52 - 103.5 Interest Rates + 103.85 Nominal Growth in GNP - 0.143 Country Risk R2 = 36.80%
This would lead to the following predicted PE ratios ñ
| Country |
|
|
|
| Peru |
|
|
|
| South Korea |
|
|
|
| Malaysia |
|
|
|
| Phillipines |
|
|
|
| India |
|
|
|
| Pakistan |
|
|
|
| Turkey |
|
|
|
| Thailand |
|
|
|
| Chile |
|
|
|
| Brazil |
|
|
|
| Argentina |
|
|
|
| Indonesia |
|
|
|
| Venezuela |
|
|
|
| Mexico |
|
|
|
| Hong Kong |
|
|
|
| Singapore |
|
|
|
Comparisons across time
Another comparison that is often made is between PE ratios across time.
As the fundamentals (interest rates and expected growth) change over time, the PE ratio will also change.
A more appropriate comparison is therefore not between PE ratios across time, but between the actual PE ratio and the predicted PE ratio based upon fundamentals existing at that time.
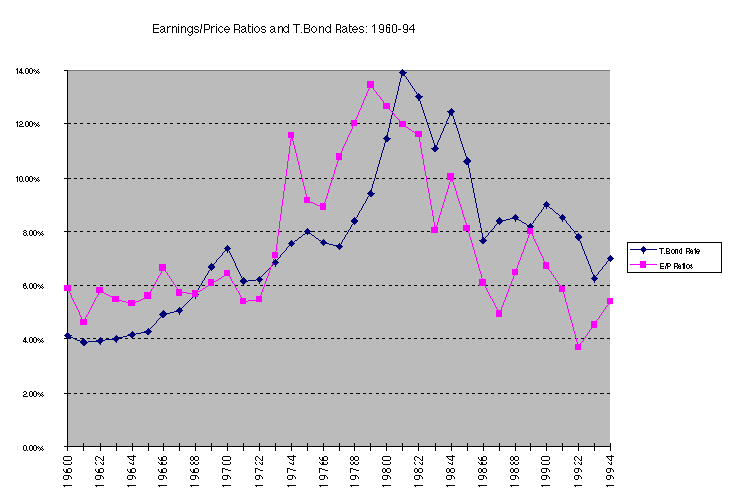
There is a strong positive relationship between E/P ratios and T.Bond rates, as evidenced by the correlation of 0.67 between the two variables.
In addition, there is evidence that the term structure also affects
the PE ratio. In the following regression, we regress E/P ratios
against the level of T.Bond rates and a term structure variable
(T.Bond - T.Bill rate)
E/P = 3.34% + 0.7160 T.Bond Rate - 0.9039 (T.Bond Rate-T.Bill
Rate) R2 = 0.795
(3.52) (6.57) (-4.03)
Other things remaining equal, this regression suggests that
Every 1% increase in the T.Bond rate increases the E/P ratio by 0.716%.
Every 1% increase in the difference between T.Bond and T.Bill rates reduces the E/P ratio by 0.90%. (As the term structure flattens out, E/P ratios should increase - PE ratios should decrease)
Comparing PE ratios across firms
PE ratios vary across industries and across firms because of differences in fundamentals - higher growth generally translates into higher PE ratios.
When comparisons are made across firms, differences in risk, growth rates and payout ratios have to be controlled for explicitly.
Using comparable firms- Pros and Cons
Using the entire crosssection: A regression approach
Updated Regressions