PRICE-SALES MULTIPLES
Issues in using price-sales multiples
Advantages of using price-sales multiples
Price-Sales Ratios and Fundamentals
PS Ratio for a stable firm
The value of equity for a stable firm, using the Gordon growth model is:

Defining the Profit Margin = EPS0 / Sales per share, the value of equity can be written as:


If the profit margin is based upon expected earnings in the next
time period, this can be simplified to,

Illustration 20: Estimating the PS ratio for a stable firm: International
Multifoods
International Multifoods had revenues per share of $134.70, earnings
per share of $1.50 in 1994, and paid out 55% of its earnings as
dividends that year. The growth rate in earnings and dividends,
in the long term, is expected to be 6%. The net profit margin
at International Multifoods in 1992 was 1.1%. The beta for International
Multifoods is 0.80 and the treasury bond rate is 7.5%.
Current Dividend Payout Ratio = 55%
Expected Growth Rate in Earnings and Dividends = 6%
Net Profit Margin = Net Income/Revenues = $1.50/134.70 = 1.11%
Cost of Equity = 7.5% + 0.8*5.5% =11.90%

where,
g = Growth rate in the first n years
Payout = Payout ratio in the first n years
gn = Growth rate after n years forever (Stable growth rate)
Payoutn = Payout ratio after n years for the stable firm

The left hand side of the equation is the price-sales ratio. It
is determined by--
(a) Net Profit Margin: Earning per share / Revenue per share. The price-sales ratio
is an increasing function of the net profit margin.
(b) Payout ratio during the high growth period and in the stable period: The PS ratio increases as the payout ratio increases.
(c) Riskiness (through the discount rate r): The PS ratio becomes lower as riskiness increases.
(d) Expected growth rate in Earnings, in both the high growth and
stable phases: The PS increases as the growth rate increases, in either period.
This formula is general enough to be applied to any firm, even
one that is not paying dividends right now.
Illustration 21: Estimating the PS ratio for a high growth firm
in the two-stage model
Assume that you have been asked to estimate the PS ratio for a
firm which has the following characteristics:
Growth rate in first five years = 20% Payout ratio in first five
years = 20%
Growth rate after five years = 8% Payout ratio after five years
= 68%
Beta = 1.0 Riskfree rate = T.Bond Rate = 6%
Net Profit Margin = 10%
Required rate of return = 6% + 1(5.5%)= 11.5%

The estimated PS ratio for this firm is 3.16.
Illustration 22: Estimating the price-sales multiple for Marks
& Spencer
High Growth Period
Expected length of high growth period = 10 years (Longer because
of international growth prospects)
Expected growth rate during high growth period = 16.00%
Net Profit Margin during high growth period = Net Profits / Revenues
= 8.88% (Same as 1994)
Payout Ratio during high growth period = 44.29% (Same as 1994)
Beta during high growth period = 0.99 (Expected to remain unchanged)
Stable Growth Period
Expected growth rate during stable growth period = 6.00%
Expected Payout Ratio during stable growth period = 65.00%
Beta is expected to remain unchanged.
The long term gilt rate (government bond) in the UK was 8.50%
at the time of this analysis, and a risk premium of 5.50% was
used.
Cost of Equity = 8.5% + 0.99 (5.5%) = 13.95%

The market value of Marks and Spencer was 1.68 times revenues
in March 1995.
Question: What would your profit margin need to be to justify
a price/sales ratio of 1.68 for Marks and Spencer? (Keep all other
inputs constant)
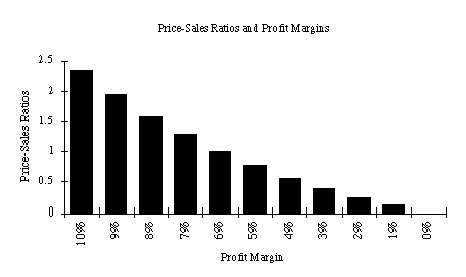
Price Sales Ratios and Profit Margins
The key determinant of price-sales ratios is the profit margin.
A decline in profit margins has a two-fold effect.
First, the reduction in profit margins reduces the price-sales ratio directly.
Second, the lower profit margin can lead to lower growth and hence
lower price-sales ratios.
Expected growth rate = Retention ratio * Return on Equity
= Retention Ratio *(Net Profit / Sales) * ( Sales / BV of Equity)
= Retention Ratio * Profit Margin * Sales/BV of Equity
Illustration 23: Estimating the effect of lower margins of price-sales
ratios
Growth Rate in first five years = 25% Payout ratio in first five
years = 20%
Growth Rate after year five = 8% Payout ratio after five years
= 50%
Beta = 1.00 Required return = 11.5%
Profit Margin = 10% Sales/BV Ratio = 2.50

For instance if the firm's profit margin declines from 10% to
5%, and the sales/BV remains unchanged:
New Growth rate in first five years = Retention Ratio * Profit
Margin * Sales/BV= .8 * .05 * 2.50 = 10%


Valuation Effects of changing from high-margin to low-margin strategy
Porter, in his examination of generic strategies, suggests that firms can follow one of two strategies to gain competitive advantage.
In the first, the firm offers a product similar to that offered by its competitors, but at a much lower price, and hopes to establish cost leadership.
In the second strategy, the firm attempts to differentiate its product from its competitors, and charge a price premium. The choice between a 'high margin, low volume' strategy (differentiation) and a 'low margin, high volume" (cost leadership) strategy can be examined using the price-sales multiple. This is illustrated in the following example.
Illustration 25 : Examining the effects of moving to a lower-margin,
higher volume strategy: Philip Morris
Philip Morris had sales of $59,131 million, earned $4,939 million
in net income and had a book value of equity of $12,563 million
in 1992. The firm paid 42% of its earnings as dividends in 1992.
The beta for the stock was 1.10.
Based upon 1992 figures, the inputs for the price/sales ratio
calculation would be:
Profit Margin = 8.35% Beta for the stock = 1.10
Sales / Book Value of Equity = 4.71 Expected Return = 7% + 1.1
(5.5%)
Book Value per share = $14.10 = 13.05%
Retention Ratio = 58%
Expected growth rate over next five years = Retention Ratio *
Profit Margin * Sales/Book
Value = 0.58 * 0.0835 * 4.71 = 22.80%
Expected growth rate after five years = 6% Expected payout ratio
after five years = 65%
Price/Sales Ratio1992 Margins =

Sales/Book Value1992 Margins = 4.71
In April 1993, Philip Morris announced that it was cutting prices on its Marlboro Brand of cigarettes because of increasing competition from low-priced competitors.
This was viewed by many analysts as a precursor of further price cuts and as a signal of a move to a lower-margin strategy. Assume that the profit margin will decline to 7% from 8.35%, as a consequence. All the other inputs are unchanged.
Expected growth rate over next five years = Retention Ratio * Profit Margin * Sales/Book Value = 0.58 * 0.07 * 4.71 = 19.12%
Expected growth rate after five years = 6% Expected payout ratio
after five years = 65%
Price/Sales Ratio1992 Margins =

As a consequence of the new lower-price strategy, the price-sales ratio will decline from 1.46 to 1.06. Unless the sales/book value ratio increases by an equivalent margin (27.40%), the value of Philip Morris will decrease. In the case where profit margins decline by this magnitude and the sales/book value is not expected to increase, the value will decline by 27.40%.
The market reacted negatively to the announcement of price cuts, and the stock price dropped approximately 20% on the announcement.
An aside on market share
There are some firms which have focused on maximizing market share
as their primary objective function. The linkage between increased
market share and market value is a tenuous one, and can be examined
using the profit-margin/price-sales ratio framework suggested
above. If increasing market share leads to higher margins, either
because of economies of scale driving down costs, or increased
market power driving out competitors, it will lead to higher value.
If the increase in the market share is accompanied by lower prices
and profit margins, the net effect on value can be negative.
From Net Income to Operating Income and Equity to Value
The profits margins for firms can be stated in terms of net income
(as they have in all the examples so far) or in terms of operating
income (EBIT). If pre-tax operating margins are used, the appropriate
value estimate is that of the firm. In particular, if one makes
the assumption that
Free Cash Flow to the Firm = EBIT (1 - tax rate): Net Capital exp. and working capital needs are zero.
Then the Value of the Firm can be written as a function of the after-tax operating margin= (EBIT (1-t)/Sales

where,
g = Growth rate in after-tax operating income for the first n
years
gn = Growth rate in after-tax operating income after n years forever
(Stable growth rate)
WACC = Weighted average cost of capital
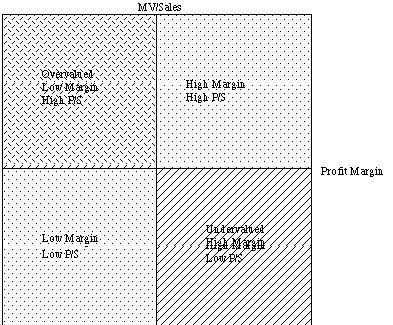
The mismatch that should draw attention

Price-Sales Ratios and Cross-sectional Data
In this approach, the cross-sectional data is used to estimate the price to sales ratio as a function of fundamental variables - profit margin, dividend payout, beta and growth rate in earnings.
Price/Sales = a + b Payout + c Growth rate in earnings + d Beta
+ e Profit Margin
Crosssectional Regressions
Year Regression R squared
1987 PS = 0.7894 + .0008 PAYOUT - 0.2734 BETA+ 0.5022 EGR + 6.46
MARGIN 0.4434
1988 PS = 0.1660 + .0006 PAYOUT - 0.0692 BETA + 0.5504 EGR + 10.31
MARGIN 0.7856
1989 PS = 0.4911 + .0393 PAYOUT - 0.0282 BETA + 0.2836 EGR + 10.25
MARGIN 0.4601
1990 PS = 0.0826 + .0105 PAYOUT - 0.1073 BETA + 0.5449 EGR + 10.36
MARGIN 0.8885
1991 PS = 0.5189 + 0.2749 PAYOUT - 0.2485 BETA + 0.4948 EGR +
8.17 MARGIN 0.4853
PS = Price /Sales Ratio at the end of the year
MARGIN = Profit Margin for the year = Net Income / Sales for the
year (in %)
PAYOUT = Payout Ratio = Dividends / Earnings BETA = Beta of the
stock
EGR = Earnings Growth rate over the previous five years
1995: PS = -0.1967 + 0.4503 PAYOUT - 0.1769 BETA + 0.0820 EGR
+ 13.02 MARGIN
R squared=0.7726
EGR = Expected earnings growth rate over next five years
Illustration 27: Valuing an acquisition target using price-sales
regressions
Assume that you had been asked to value Wellcome Inc.
Sales in 1994 = 4350 million
Net Income in 1994 = 845 million
Beta = 0.60
Dividend Payout Ratio = 50%
First compute the variables in the desired units,
Profit Margin =845/4350 = 19.43%
Payout = 50%
Earnings Growth Rate= 10%
Beta = 0.60
Predicted Price/Sales Ratio = - 0.1967 + 0.4503 (0.50) - 0.1769
(0.60) + 0.0820 (0.10) + 13.02 (0.1943) = 2.46
Predicted Market Value of Equity = 2.46 * 4350 = $10,701 million
Using price-sales ratios in investment strategies