Relative PE: Cross Sectional Distribution
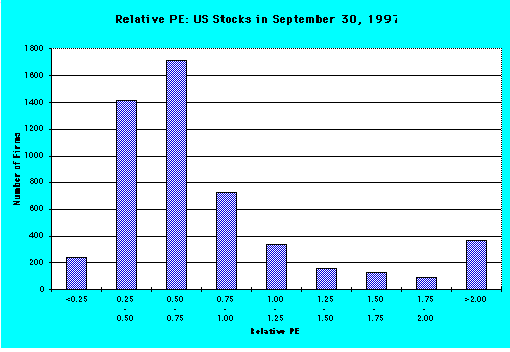
Relative PE: Distributional Statistics
Relative PE = PE of Firm / PE of Market
Relative PE: Cross Sectional Distribution
Relative PE: Distributional Statistics
Mean 1.00 Std Dev .997
Variance .995 Kurtosis 15.289
S.E. Kurt .068 Skewness 3.713
S.E. Skew .034 Minimum .00
Maximum 6.27 Median 0.60
Relative PE: Determinants
To analyze the determinants of the relative PE ratios, let us revisit the discounted cash flow model we developed for the PE ratio. Using the 2-stage DDM model as our basis (replacing the payout ratio with the FCFE/Earnings Ratio, if necessary), we get
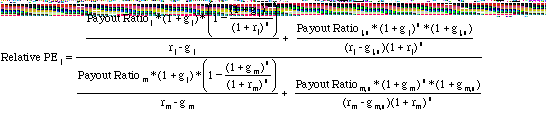
where Payoutj, gj, rj = Payout, growth and risk of the firm
Payoutm, gm, rm = Payout, growth and risk of the market
Relative PE: A Simple Example
Consider the following example of a firm growing at twice the rate as the market, while having the same growth and risk characteristics of the market:
Firm Market
Expected growth rate 20% 10%
Length of Growth Period 5 years 5 years
Payout Ratio: first 5 yrs 30% 30%
Growth Rate after yr 5 6% 6%
Payout Ratio after yr 5 50% 50%
Beta 1.00 1.00
Riskfree Rate = 6%
Estimating Relative PE
The relative PE ratio for this firm can be estimated in two steps. First, we compute the PE ratio for the firm and the market separately:
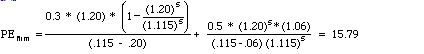
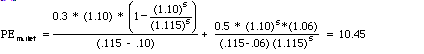
Relative PE Ratio = 15.79/10.45 = 1.51
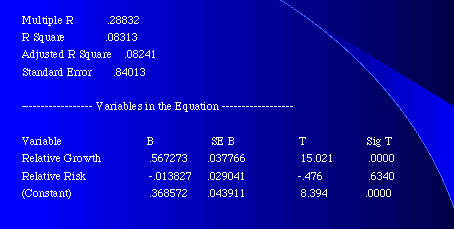
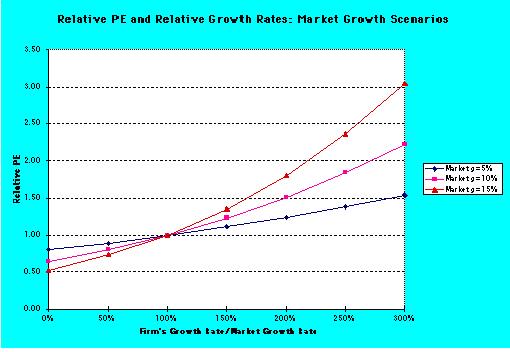
Relative PE and Relative Growth
Relative PE: Another Example
In this example, consider a firm with twice the risk as the market, while having the same growth and payout characteristics as the firm:
Firm Market
Expected growth rate 10% 10%
Length of Growth Period 5 years 5 years
Payout Ratio: first 5 yrs 30% 30%
Growth Rate after yr 5 6% 6%
Payout Ratio after yr 5 50% 50%
Beta in first 5 years 2.00 1.00
Beta after year 5 1.00 1.00
Riskfree Rate = 6%
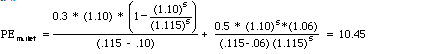
Estimating Relative PE
The relative PE ratio for this firm can be estimated in two steps. First, we compute the PE ratio for the firm and the market separately:

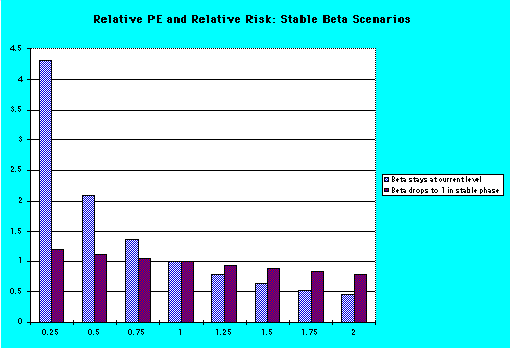
Relative PE and Relative Risk
Relative PE: Summary of Determinants
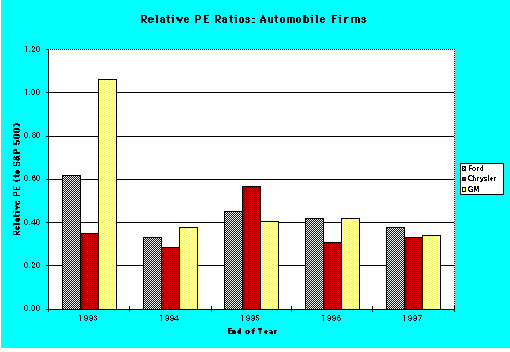
Relative PE Ratios: The Auto Sector
Using Relative PE ratios
On a relative PE basis, all of the automobile stocks look cheap because they are trading at their lowest relative PE ratios in five years. Why might the relative PE ratio be lower today than it was 5 years ago?
Relative PE: Why do they change?
Historically, GM has traded at the highest relative PE ratio of the three auto companies, and Chrysler has traded at the lowest. In the last two or three years, this historical relationship has been upended with Ford now trading at the highest relative PE ratio. Analyst projections for earnings growth at the three companies are about the same. How would you explain the shift?
Relative PE Ratios: Market Analysis