Valeant, Picking at Scabs
In November 2015, I looked at Valeant, when it was in the midst of legal, management and business turmoil, and concluded that while the stock price had collapsed (from almost $200 down to $75-80), it was not a bargain. My valuation of Valeant, at the time, was approximately $72/share. In the months following, things went from bad to worse and the stock continued to plummet, hitting $27/share in May 2016. At the time, I revalued Valeant, with the belated release of information, at $43/share in this blog post. I said I would buy the shares and carried through on that promise. Needless to say, the stock has not been a shining star in my portfolio, briefly dropping to $14/share, after its most recent earnings report.
To decide whether I should continue to hold the stock, buy more or sell it, I revalued the company today, using the most recent quarterly report and estimate a value per share of approximately $33. That valuation is at this link. Before I pulled the trigger and bought more shares the company, I decided to look at the pricing of Valeant, relative to other North American drug companies.
I started by downloading the data on all publicly traded drug companies listed in the US or Canada and came up with a sample of 212 companies and narrowed the sample to only the 23 companies with market capitalization exceeding $ 1 billion. I computed a range of multiples, including two equity multiples (PE and PBV), a revenue multiple (EV/Sales), an invested capital multiple (EV/Invested Capital) and earnings-based EV multiples (EV/EBITDA and EV/EBITDAR). In the last one (EBITDAR), I added the R&D to EBITDA to eliminate the bias created by treating R&D as an operating expense. I also collected and computed information on accounting returns (ROE and ROIC), profitability (net profit margin, operating margin, EBITDAR/Sales), risk (beta, standard deviation) and growth (expected EPS growth for next 5 years and historic growth in revenues over last 5 years). You can download the entire worksheet by clicking here. The graph below captures the differences on pricing multiples between Valeant and other drug companies (with market capitalizations> $1 billion).
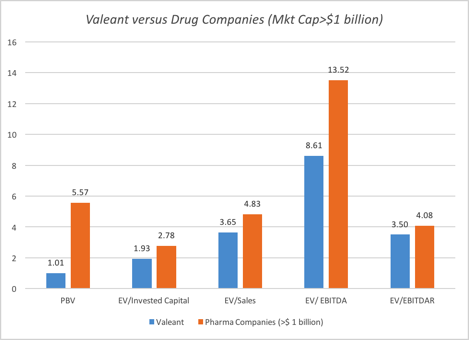
The bottom line is simple. Valeant looks cheap on every single pricing multiple, but more so on price to book than EV to invested capital, and more on EV/EBITDA than on EV/EBITDAR. (If you are wondering why there is no PE ratio comparison, it is because Valeant had negative EPS over the trailing 12 months and the PE ratio is not meaningful.)
This, as we well know, is only part of the story. So, to complete the story, I compared Valeant to the rest of the sector on profitability, growth and risk measures:
|
|
Valeant |
Pharma Companies (>$ 1 billion) |
|
Growth |
||
|
Expected growth in EPS (next 5 yrs) |
12.20% |
9.50% |
|
CAGR in Revenues (last 5 years) |
34.40% |
0.00% |
|
Risk |
||
|
Beta |
0.29 |
0.83 |
|
Debt/Capital (Market) |
83.60% |
16.25% |
|
Debt/Capital (Book) |
83.76% |
59.78% |
|
Profitability |
||
|
Net Profit Margin |
-22.75% |
7.22% |
|
Operating Margin |
13.35% |
13.70% |
|
EBITDAR/Sales |
46.63% |
39.19% |
|
Return Measures |
||
|
ROE |
-37.82% |
9.22% |
|
ROIC |
3.66% |
16.41% |
The growth numbers for Valeant look promising but are deceptive. The historic growth reflects Valeant’s glory years of acquisition driven growth, which are gone forever and the high expected growth reflects how depressed net income is in 2016. On risk, there is a red flag in the high debt ratios, at levels that can put the company’s survival at risk and the beta is low only because Valeant has managed to keep going down, even as the market has stayed stable or even increased. On profitability, the net margin is negative but Valeant’s EBITDAR margin is higher than the sector average. The return on invested capital and equity are abysmal but that again is the residue of their acquisitive history, with goodwill comprising a big part of invested capital.
Overall, the pricing does back up the intrinsic value. I will use the EBITDAR multiple as my primary pricing tool (since using equity multiples in the presence of an astronomically high debt ratio can throw off comparisons) and I am consoled by the healthy EBITDAR margin, in a bad year (last twelve months). The debt is a concern and weighs against the company and I ran a regression of EV/EBITDAR and Debt/capital ratios to see if there was a way that I could control for differences. The results were indecisive; at least in this sector, there is not much of a relationship between the multiple and the fundamentals. So, I guess that I am doubling down on Valeant, buying more shares to augment a losing position! I have a feeling that I will be revisiting this story.