 Dividend Regressions: January 2022
Variables used in the regression
- Dividend
Yield = Dividends per share in most recent year/ Current Stock Price
- Dividend
Payout Ratio = Dividends / Net Income
- Beta: Regression or Bottom up beta
- Expected
Growth in EPS over next 5 years = Consensus analyst estimate (or your own)
of expected growth in EPS

Regression Output
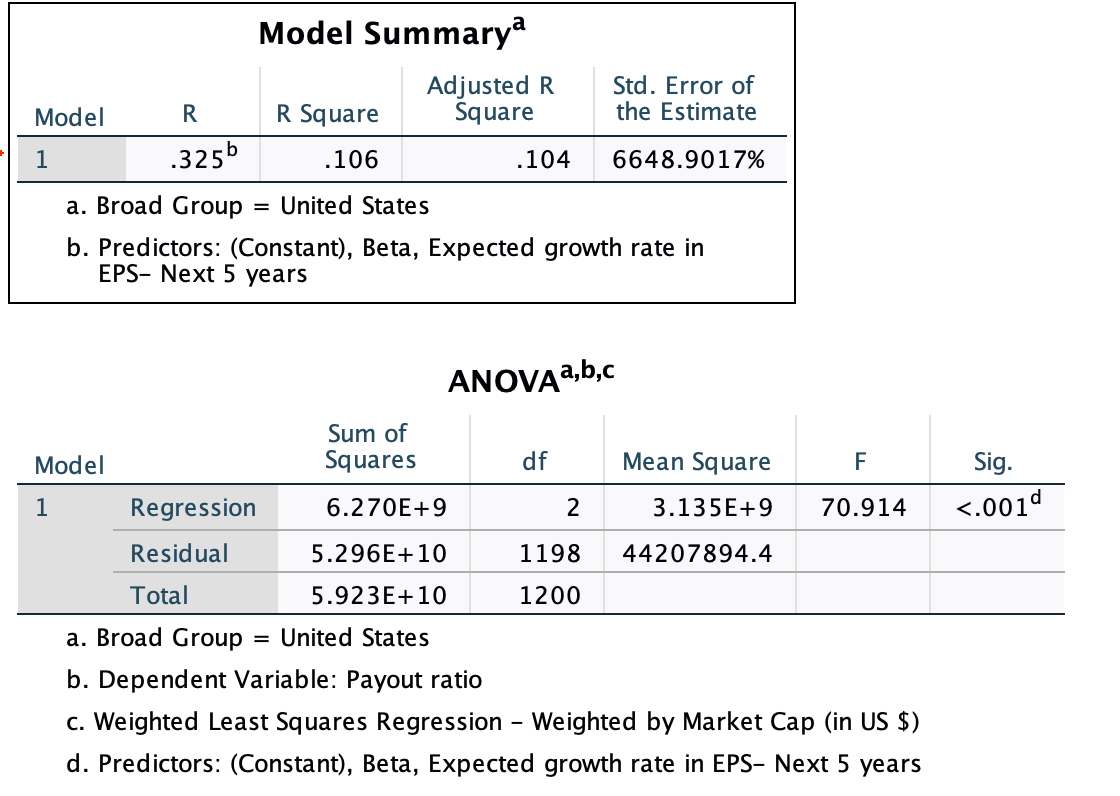
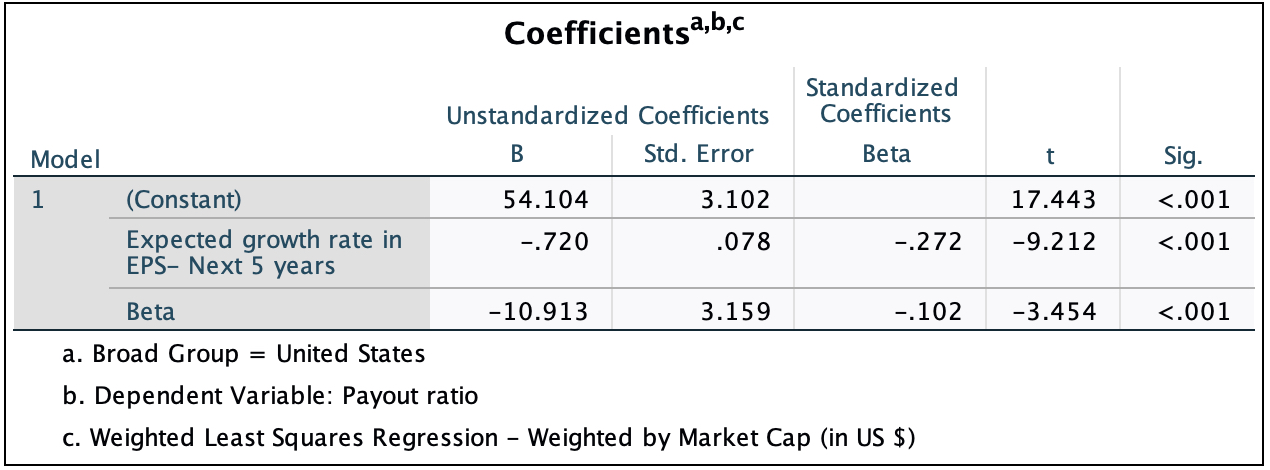
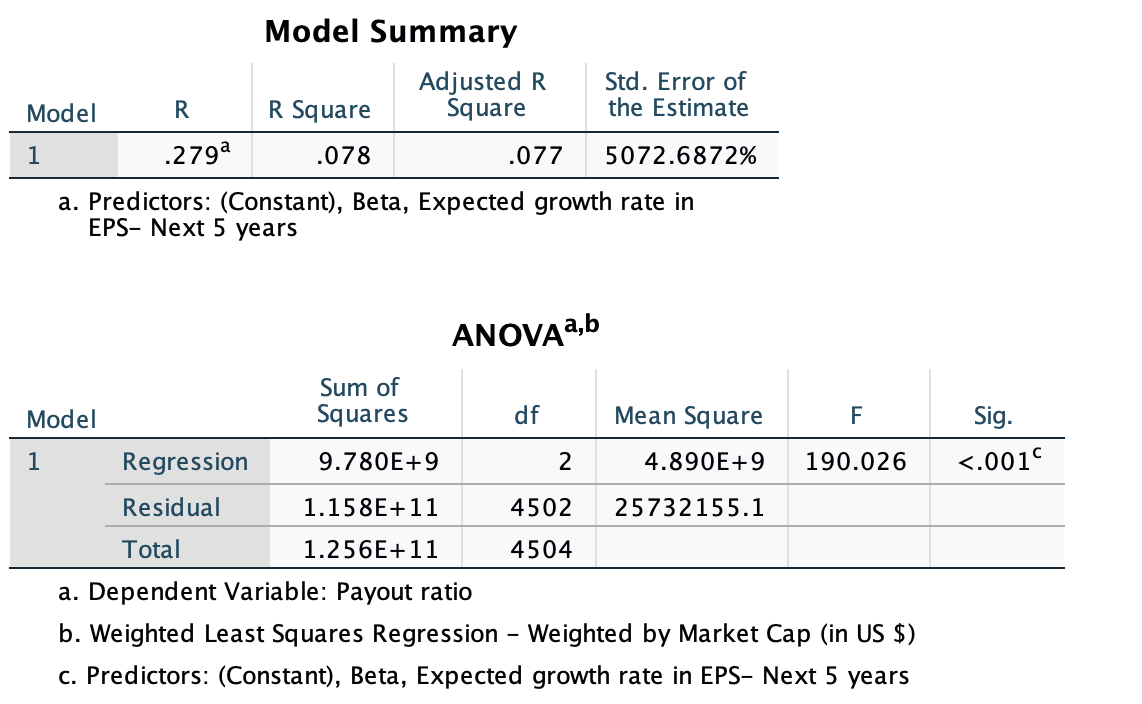
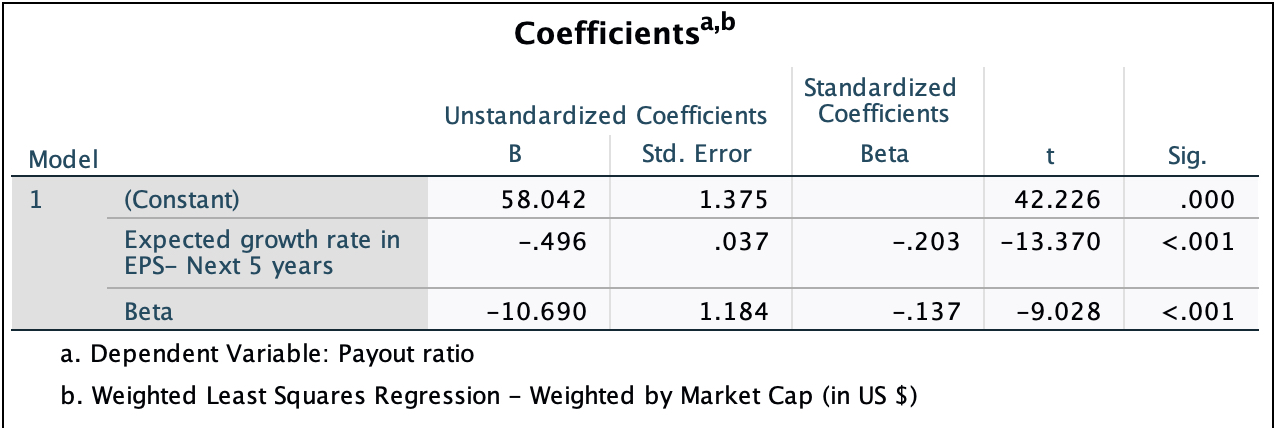
US Regression: Dividend Payout
Regression Output
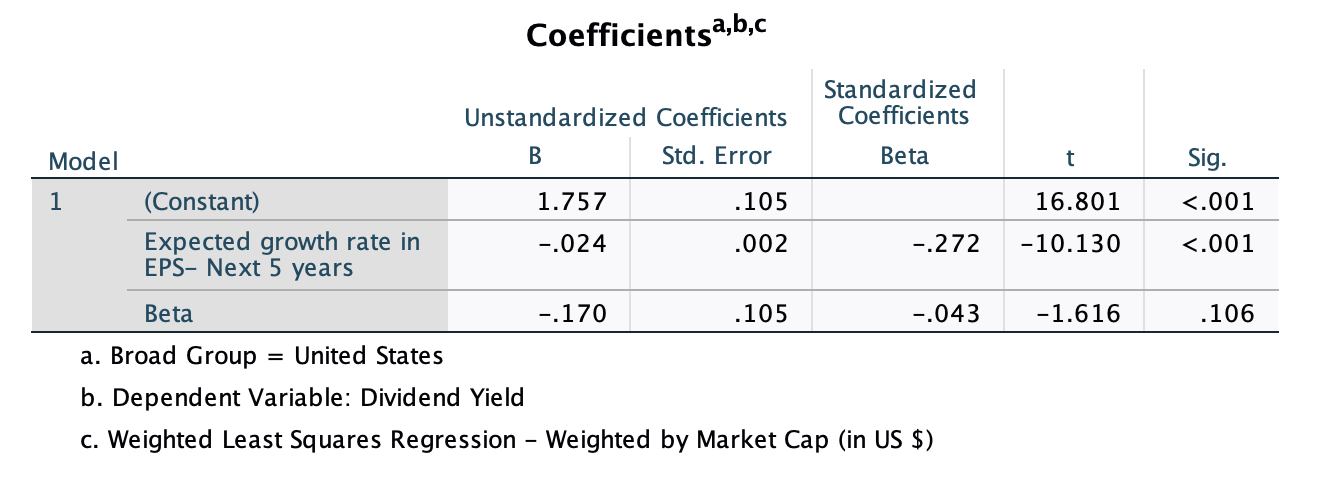
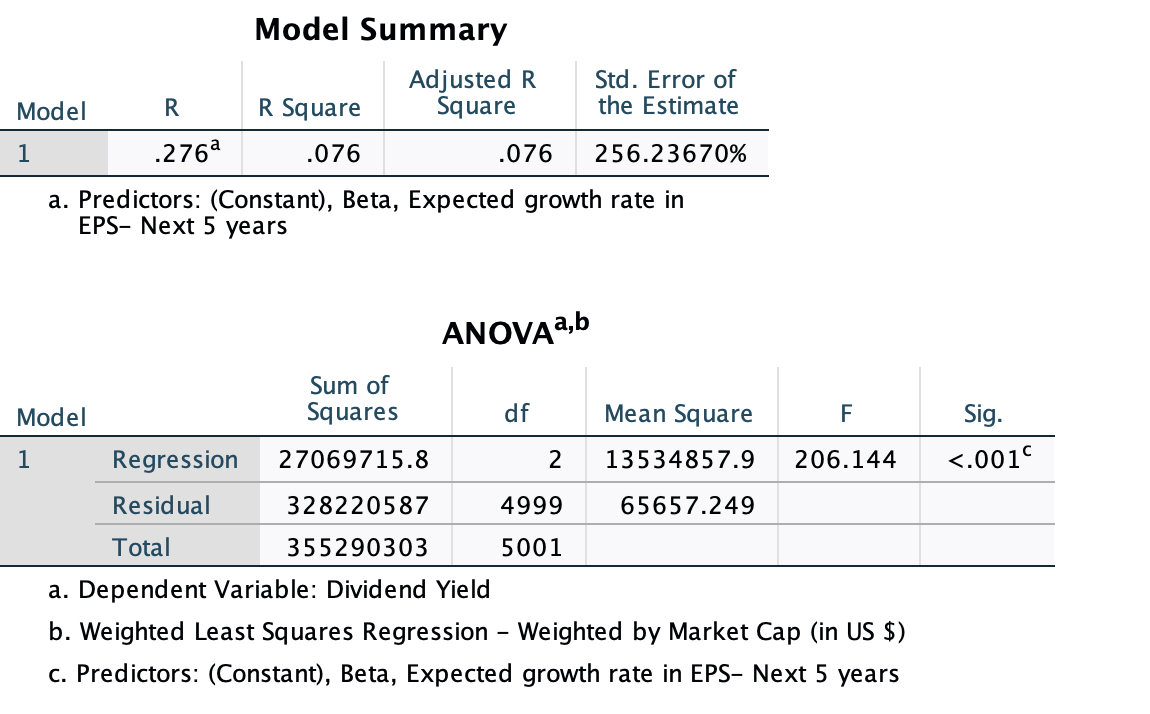
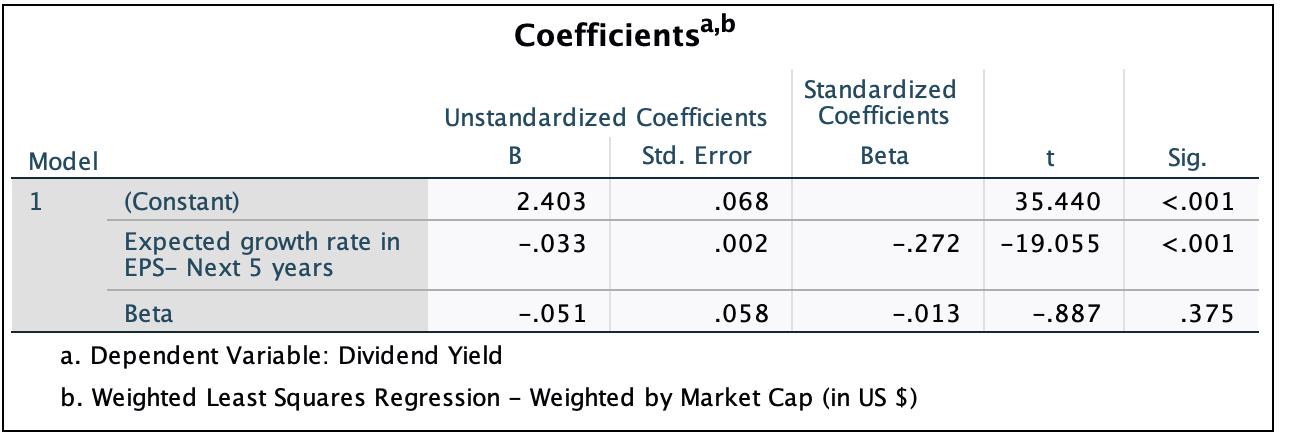
Global Regression: Dividend Yield
Regression Output
Global Regression: Dividend Payout
Regression Output
- How do I use this regression?
Assume that you want to estimate the dividend payout ratio for a firm with the following characteristics, using the US regression:
Regression beta = 1.20
Expected Growth in EPS over next 5 years = 10%
- Predicted Values
- Expected Dividend Yield =1.76 -0.024 (10) - .17 (1.20) = 1.32 or 1.32%
- Expected Dividend payout ratio = 54.10 - 0.72 (10) - 10.91 (1.20)= 33.80 or 33.80%
If your predicted value is less than zero, your predicted dividend payout ratio is zero.