 Dividend Regressions: January 2023
Variables used in the regression
- Dividend
Yield = Dividends per share in most recent year/ Current Stock Price
- Dividend
Payout Ratio = Dividends / Net Income
- Beta: Regression or Bottom up beta
- Expected
Growth in EPS over next 5 years = Consensus analyst estimate (or your own)
of expected growth in EPS
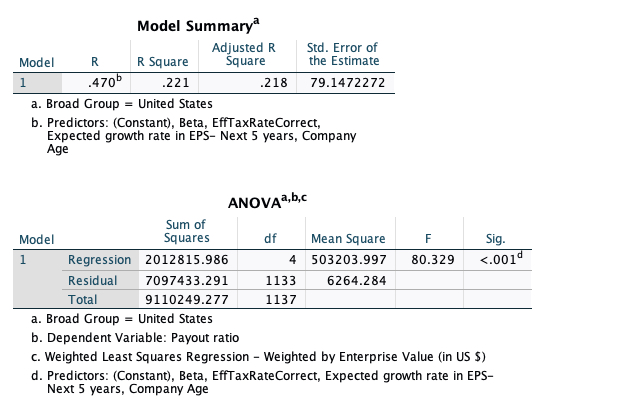
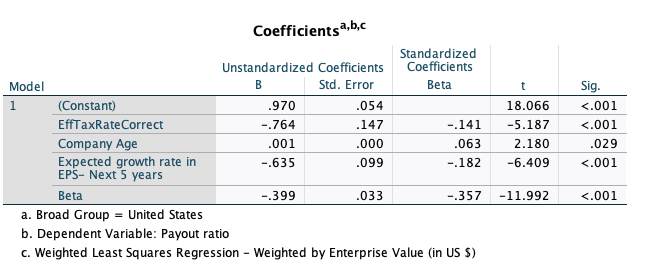
Regression Output
US Regression: Dividend Payout
Regression Output
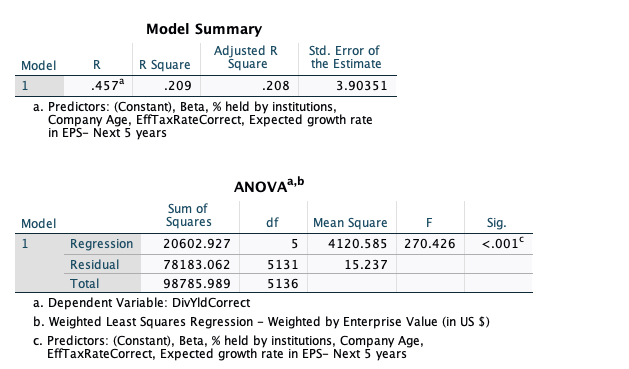
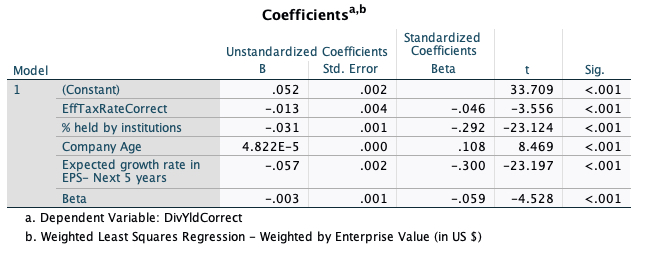
Global Regression: Dividend Yield
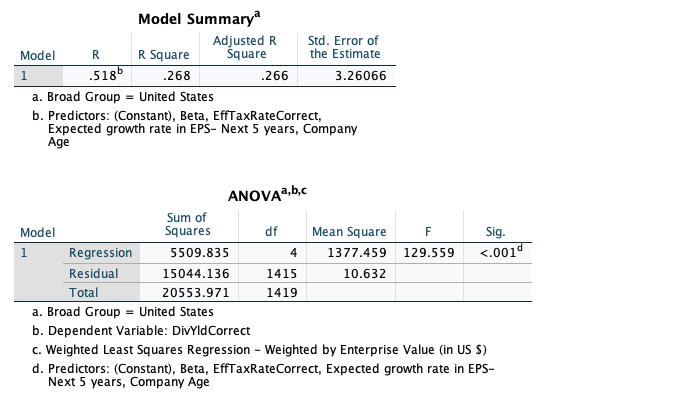
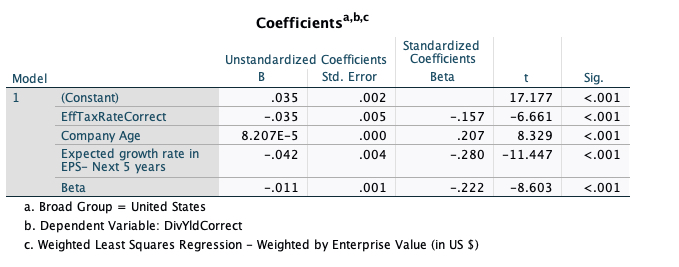
Regression Output
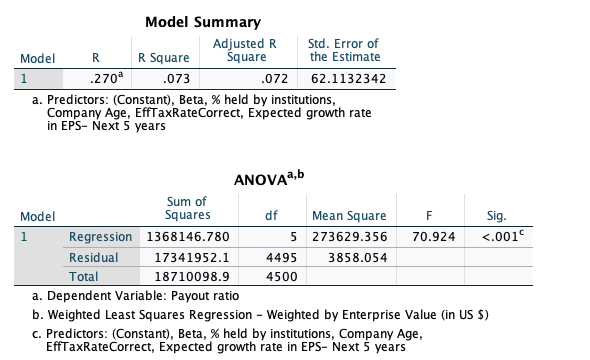
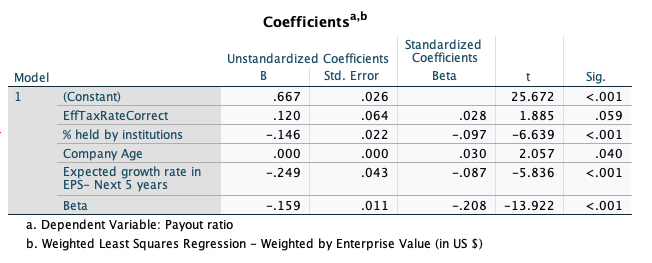
Global Regression: Dividend Payout
Regression Output
- How do I use this regression?
Assume that you want to estimate the dividend payout ratio for a firm with the following characteristics, using the US regression:
% held by instiutions = 30%
Regression beta = 1.20
Expected Growth in EPS over next 5 years = 10%
Company Age = 35
- Predicted Values
- Expected Dividend Yield = 3.26 - .005 (30) + 0.005 (35) - 0.020 (10) - 1.167 (1.20) = 1.6846 or 1.68%
- Expected Dividend payout ratio = 77.57 + 0.191 (30) - 0.085(35) + 0.552 (10) -34.84 (1.20) = 44.04 or 44.04%
If your predicted value is less than zero, your predicted dividend payout ratio is zero.