|
Model Summary |
||||
|
Model |
R |
R Square |
Adjusted R Square |
Std. Error of the Estimate |
|
1 |
.647a |
.419 |
.418 |
1273.85784 |
|
a. Predictors: (Constant), 3-yr
Regression Beta, Expected Growth in EPS: next 5 years, Payout Ratio |
||||
|
Coefficientsa,b |
||||||
|
Model |
Unstandardized Coefficients |
Standardized Coefficients |
t |
Sig. |
||
|
B |
Std. Error |
Beta |
||||
|
1 |
(Constant) |
2.741 |
.914 |
|
2.999 |
.003 |
|
Expected Growth in EPS: next 5
years |
142.627 |
4.029 |
.669 |
35.397 |
.000 |
|
|
Payout Ratio |
5.668 |
1.199 |
.090 |
4.726 |
.000 |
|
|
3-yr Regression Beta |
.550 |
.477 |
.021 |
1.153 |
.249 |
|
|
a. Dependent Variable: Current
PE |
|
|
|
|
||
|
b. Weighted Least Squares
Regression - Weighted by Market Cap |
|
|
||||
The Multicollinearity
Problem
|
Correlations |
|||||
|
|
|
Current PE |
Payout Ratio |
Expected Growth in EPS: next 5 years |
Regression Beta |
|
Current PE |
Pearson Correlation |
1 |
-.084** |
.432** |
.078** |
|
Sig. (2-tailed) |
|
.000 |
.000 |
.000 |
|
|
N |
4062 |
4031 |
2206 |
3283 |
|
|
Payout Ratio |
Pearson Correlation |
-.084** |
1 |
-.275** |
-.115** |
|
Sig. (2-tailed) |
.000 |
|
.000 |
.000 |
|
|
N |
4031 |
4118 |
2230 |
3318 |
|
|
Expected Growth in EPS: next 5
years |
Pearson Correlation |
.432** |
-.275** |
1 |
.171** |
|
Sig. (2-tailed) |
.000 |
.000 |
|
.000 |
|
|
N |
2206 |
2230 |
2631 |
2206 |
|
|
Regression Beta |
Pearson Correlation |
.078** |
-.115** |
.171** |
1 |
|
Sig. (2-tailed) |
.000 |
.000 |
.000 |
|
|
|
N |
3283 |
3318 |
2206 |
5200 |
|
|
**. Correlation is significant at the 0.01 level (2-tailed). |
|
|
|
||
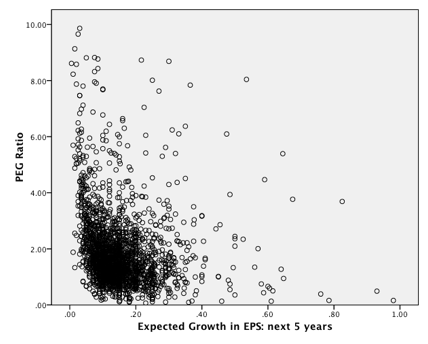
PEG Ratio Regression with intercept
|
Model Summary |
||||
|
Model |
R |
R Square |
Adjusted R Square |
Std. Error of the Estimate |
|
1 |
.483a |
.233 |
.232 |
99.60100 |
|
a. Predictors: (Constant),
Payout Ratio, Regression Beta, ln (Expcted Growth) |
||||
|
Coefficientsa,b |
||||||
|
Model |
Unstandardized Coefficients |
Standardized Coefficients |
t |
Sig. |
||
|
B |
Std. Error |
Beta |
||||
|
1 |
(Constant) |
-.149 |
.106 |
|
-1.395 |
.163 |
|
ln (Expcted Growth) |
-.830 |
.041 |
-.441 |
-2.016E1 |
.000 |
|
|
Regression Beta |
.162 |
.037 |
.093 |
4.351 |
.000 |
|
|
Payout Ratio |
.554 |
.095 |
.129 |
5.820 |
.000 |
|
|
a. Dependent Variable: PEG
Ratio |
|
|
|
|
||
|
b. Weighted Least Squares
Regression - Weighted by Market Cap |
|
|
||||
PEG ratio with no intercept
|
Model Summary |
||||
|
Model |
R |
R Squareb |
Adjusted R Square |
Std. Error of the Estimate |
|
1 |
.909a |
.826 |
.825 |
99.62656 |
|
a. Predictors: Payout Ratio,
Regression Beta, ln (Expcted
Growth) |
||||
|
b. For regression through the
origin (the no-intercept model), R Square measures the proportion of the
variability in the dependent variable about the origin explained by
regression. This CANNOT be compared to R Square for models
which include an intercept. |
||||
|
Coefficientsa,b,c |
||||||
|
Model |
Unstandardized Coefficients |
Standardized Coefficients |
t |
Sig. |
||
|
B |
Std. Error |
Beta |
||||
|
1 |
ln (Expcted Growth) |
-.782 |
.023 |
-.775 |
-3.448E1 |
.000 |
|
Regression Beta |
.133 |
.031 |
.072 |
4.309 |
.000 |
|
|
Payout Ratio |
.541 |
.095 |
.093 |
5.708 |
.000 |
|
|
a. Dependent Variable: PEG
Ratio |
|
|
|
|
||
|
b. Linear Regression through
the Origin |
|
|
|
|||
|
c. Weighted Least Squares
Regression - Weighted by Market Cap |
|
|
||||
EV/EBITDA Multiple Regressions
|
Model Summary |
||||
|
Model |
R |
R Square |
Adjusted R Square |
Std. Error of the Estimate |
|
1 |
.671a |
.450 |
.448 |
722.68533 |
|
a. Predictors: (Constant),
Reinvestment Rate, Expected Growth in Revenues: next 5 years, Eff Tax Rate, ROC |
||||
|
Coefficientsa,b |
||||||
|
Model |
Unstandardized Coefficients |
Standardized Coefficients |
t |
Sig. |
||
|
B |
Std. Error |
Beta |
||||
|
1 |
(Constant) |
4.490 |
.676 |
|
6.644 |
.000 |
|
Expected Growth in Revenues:
next 5 years |
96.970 |
3.320 |
.640 |
29.212 |
.000 |
|
|
Effective Tax Rate |
-9.284 |
1.761 |
-.114 |
-5.271 |
.000 |
|
|
ROC |
1.745 |
1.346 |
.028 |
1.296 |
.195 |
|
|
Reinvestment Rate |
-1.837 |
.544 |
-.073 |
-3.380 |
.001 |
|
|
a. Dependent Variable:
EV/EBITDA |
|
|
|
|
||
|
b. Weighted Least Squares
Regression - Weighted by Market Cap |
|
|
||||
|
Model Summary |
||||
|
Model |
R |
R Square |
Adjusted R Square |
Std. Error of the Estimate |
|
1 |
.613a |
.376 |
.374 |
945.25361 |
|
a. Predictors: (Constant),
Reinvestment Rate, Expected Growth in Revenues: next 5 years, Eff Tax Rate, ROC |
||||
|
Coefficientsa,b |
||||||
|
Model |
Unstandardized Coefficients |
Standardized Coefficients |
t |
Sig. |
||
|
B |
Std. Error |
Beta |
||||
|
1 |
(Constant) |
8.641 |
.884 |
|
9.776 |
.000 |
|
Expected Growth in Revenues:
next 5 years |
109.581 |
4.342 |
.589 |
25.238 |
.000 |
|
|
Eff Tax Rate |
-14.465 |
2.304 |
-.145 |
-6.279 |
.000 |
|
|
ROC |
-2.835 |
1.761 |
-.038 |
-1.610 |
.108 |
|
|
Reinvestment Rate |
-2.252 |
.711 |
-.073 |
-3.167 |
.002 |
|
|
a. Dependent Variable: EV/EBIT |
|
|
|
|
||
|
b. Weighted Least Squares
Regression - Weighted by Market Cap |
|
|
||||
Regression with intercept
|
Model Summary |
||||
|
Model |
R |
R Square |
Adjusted R Square |
Std. Error of the Estimate |
|
1 |
.636a |
.404 |
.403 |
421.28395 |
|
a. Predictors: (Constant),
Dividend Payout, ROE, Regression Beta, Expected Growth in EPS: next 5 years |
||||
|
Coefficientsa,b |
||||||
|
Model |
Unstandardized Coefficients |
Standardized Coefficients |
t |
Sig. |
||
|
B |
Std. Error |
Beta |
||||
|
1 |
(Constant) |
-4.523 |
.339 |
|
-1.335E1 |
.000 |
|
ROE |
23.034 |
.812 |
.502 |
28.369 |
.000 |
|
|
Expected Growth in EPS: next 5
years |
26.253 |
1.266 |
.391 |
20.745 |
.000 |
|
|
Regression Beta |
.842 |
.156 |
.100 |
5.396 |
.000 |
|
|
Dividend Payout |
.569 |
.347 |
.031 |
1.638 |
.102 |
|
|
a. Dependent Variable: PBV
Ratio |
|
|
|
|
||
|
b. Weighted Least Squares
Regression - Weighted by Market Cap |
|
|
||||
Without intercept
|
Model Summary |
||||
|
Model |
R |
R Squareb |
Adjusted R Square |
Std. Error of the Estimate |
|
1 |
.801a |
.641 |
.640 |
440.76056 |
|
a. Predictors: ROE, Payout
Ratio, Expected Growth in EPS: next 5 years, Regression Beta |
||||
|
b. For regression through the
origin (the no-intercept model), R Square measures the proportion of the
variability in the dependent variable about the origin explained by
regression. This CANNOT be compared to R Square for models
which include an intercept. |
||||
|
Coefficientsa,b,c |
||||||
|
Model |
Unstandardized Coefficients |
Standardized Coefficients |
t |
Sig. |
||
|
B |
Std. Error |
Beta |
||||
|
1 |
Payout Ratio |
-2.344 |
.333 |
-.131 |
-7.042 |
.000 |
|
Regression Beta |
-.110 |
.146 |
-.019 |
-.759 |
.448 |
|
|
Expected Growth in EPS: next 5
years |
18.019 |
1.168 |
.370 |
15.429 |
.000 |
|
|
ROE |
17.294 |
.717 |
.589 |
24.114 |
.000 |
|
|
a. Dependent Variable: PBV
Ratio |
|
|
|
|
||
|
b. Linear Regression through
the Origin |
|
|
|
|
||
|
c. Weighted Least Squares
Regression - Weighted by Market Cap |
|
|
||||
With intercept
|
Model Summary |
||||
|
Model |
R |
R Square |
Adjusted R Square |
Std. Error of the Estimate |
|
1 |
.745a |
.555 |
.554 |
458.86341 |
|
a. Predictors: (Constant),
Market Debt to Capital, Expected Growth in Revenues: next 5 years, ROC |
||||
|
|
||||
|
|
||||
|
Coefficientsa,b |
||||||
|
Model |
Unstandardized Coefficients |
Standardized Coefficients |
t |
Sig. |
||
|
B |
Std. Error |
Beta |
||||
|
1 |
(Constant) |
-3.921 |
.356 |
|
-1.101E1 |
.000 |
|
ROC |
18.057 |
.875 |
.424 |
20.633 |
.000 |
|
|
Expected Growth in Revenues:
next 5 years |
52.156 |
1.974 |
.498 |
26.415 |
.000 |
|
|
Market Debt to Capital |
-2.590 |
.808 |
-.066 |
-3.205 |
.001 |
|
|
a. Dependent Variable: EV/
Invested Capital |
|
|
|
|||
|
b. Weighted Least Squares
Regression - Weighted by Market Cap |
|
|
||||
Without intercept
|
Model Summary |
||||
|
Model |
R |
R Squareb |
Adjusted R Square |
Std. Error of the Estimate |
|
1 |
.837a |
.701 |
.700 |
478.94395 |
|
a. Predictors: Market Debt to
Capital, ROC, Expected Growth in Revenues: next 5 years |
||||
|
b. For regression through the
origin (the no-intercept model), R Square measures the proportion of the
variability in the dependent variable about the origin explained by
regression. This CANNOT be compared to R Square for models
which include an intercept. |
||||
|
Coefficientsa,b,c |
||||||
|
Model |
Unstandardized Coefficients |
Standardized Coefficients |
t |
Sig. |
||
|
B |
Std. Error |
Beta |
||||
|
1 |
ROC |
11.342 |
.655 |
.413 |
17.322 |
.000 |
|
Expected Growth in Revenues:
next 5 years |
41.329 |
1.787 |
.570 |
23.130 |
.000 |
|
|
Market Debt to Capital |
-8.670 |
.616 |
-.241 |
-1.408E1 |
.000 |
|
|
a. Dependent Variable: EV/
Invested Capital |
|
|
|
|||
|
b. Linear Regression through
the Origin |
|
|
|
|
||
|
c. Weighted Least Squares
Regression - Weighted by Market Cap |
|
|
||||
With intercept
|
Model Summary |
||||
|
Model |
R |
R Square |
Adjusted R Square |
Std. Error of the Estimate |
|
1 |
.761a |
.578 |
.577 |
248.68771 |
|
a. Predictors: (Constant), Net
Margin, Dividend Payout, Regression Beta, Expected Growth in EPS: next 5
years |
||||
|
Coefficientsa,b |
||||||
|
Model |
Unstandardized Coefficients |
Standardized Coefficients |
t |
Sig. |
||
|
B |
Std. Error |
Beta |
||||
|
1 |
(Constant) |
-2.594 |
.186 |
|
-1.396E1 |
.000 |
|
Expected Growth in EPS: next 5
years |
20.064 |
.760 |
.447 |
26.396 |
.000 |
|
|
Regression Beta |
-.049 |
.094 |
-.009 |
-.521 |
.602 |
|
|
Dividend Payout |
.063 |
.213 |
.005 |
.297 |
.767 |
|
|
Net Margin |
25.355 |
.708 |
.579 |
35.827 |
.000 |
|
|
a. Dependent Variable: PS Ratio |
|
|
|
|
||
|
b. Weighted Least Squares
Regression - Weighted by Market Cap |
|
|
||||
Without intercept
|
Model Summary |
||||
|
Model |
R |
R Squareb |
Adjusted R Square |
Std. Error of the Estimate |
|
1 |
.862a |
.743 |
.743 |
262.38542 |
|
a. Predictors: Expected Growth
in EPS: next 5 years, Payout Ratio, Net Margin, Regression Beta |
||||
|
b. For regression through the
origin (the no-intercept model), R Square measures the proportion of the
variability in the dependent variable about the origin explained by
regression. This CANNOT be compared to R Square for models
which include an intercept. |
||||
|
Coefficientsa,b,c |
||||||
|
Model |
Unstandardized Coefficients |
Standardized Coefficients |
t |
Sig. |
||
|
B |
Std. Error |
Beta |
||||
|
1 |
Net Margin |
21.827 |
.696 |
.688 |
31.340 |
.000 |
|
Payout Ratio |
-1.892 |
.202 |
-.150 |
-9.382 |
.000 |
|
|
Regression Beta |
-.632 |
.089 |
-.161 |
-7.062 |
.000 |
|
|
Expected Growth in EPS: next 5
years |
14.934 |
.706 |
.459 |
21.149 |
.000 |
|
|
a. Dependent Variable: PS
Ratio |
|
|
|
|
||
|
b. Linear Regression through
the Origin |
|
|
|
|
||
|
c. Weighted Least Squares
Regression - Weighted by Market Cap |
|
|
||||
With intercept
|
Model Summary |
||||
|
Model |
R |
R Square |
Adjusted R Square |
Std. Error of the Estimate |
|
1 |
.732a |
.536 |
.535 |
288.57291 |
|
a. Predictors: (Constant),
Pre-tax Operating Margin, Expected Growth in Revenues: next 5 years, Market
Debt to Capital |
||||
|
Coefficientsa,b |
||||||
|
Model |
Unstandardized Coefficients |
Standardized Coefficients |
t |
Sig. |
||
|
B |
Std. Error |
Beta |
||||
|
1 |
(Constant) |
-1.542 |
.177 |
|
-8.687 |
.000 |
|
Expected Growth in Revenues:
next 5 years |
32.909 |
1.207 |
.536 |
27.274 |
.000 |
|
|
Market Debt to Capital |
-2.985 |
.469 |
-.126 |
-6.369 |
.000 |
|
|
Pre-tax Operating Margin |
9.334 |
.467 |
.383 |
20.000 |
.000 |
|
|
a. Dependent Variable: EV/Sales |
|
|
|
|
||
|
b. Weighted Least Squares
Regression - Weighted by Market Cap |
|
|
||||
Without intercept
|
Model Summary |
||||
|
Model |
R |
R Squareb |
Adjusted R Square |
Std. Error of the Estimate |
|
1 |
.865a |
.747 |
.747 |
296.20201 |
|
a. Predictors: Pre-tax
Operating Margin, Market Debt to Capital, Expected Growth in Revenues: next
5 years |
||||
|
b. For regression through the
origin (the no-intercept model), R Square measures the proportion of the
variability in the dependent variable about the origin explained by
regression. This CANNOT be compared to R Square for models
which include an intercept. |
||||
|
Coefficientsa,b,c |
||||||
|
Model |
Unstandardized Coefficients |
Standardized Coefficients |
t |
Sig. |
||
|
B |
Std. Error |
Beta |
||||
|
1 |
Expected Growth in Revenues:
next 5 years |
26.494 |
.980 |
.577 |
27.048 |
.000 |
|
Market Debt to Capital |
-4.670 |
.438 |
-.191 |
-1.066E1 |
.000 |
|
|
Pre-tax Operating Margin |
7.556 |
.431 |
.442 |
17.551 |
.000 |
|
|
a. Dependent Variable:
EV/Sales |
|
|
|
|
||
|
b. Linear Regression through
the Origin |
|
|
|
|
||
|
c. Weighted Least Squares
Regression - Weighted by Market Cap |
|
|
||||