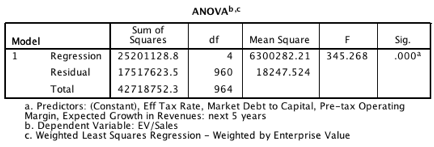
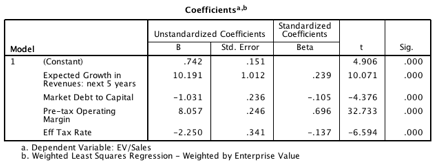
Data Analysis and Regressions: US
companies in January 2011
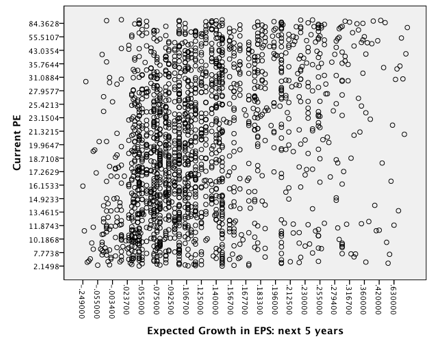
a.
PE
versus Expected Growth in EPS – Scatter Plot
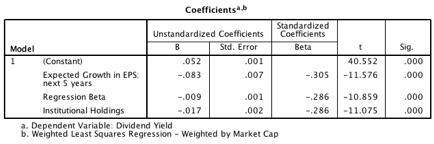
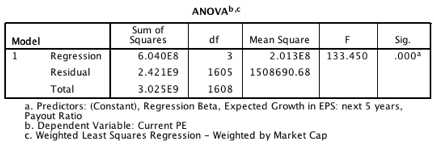
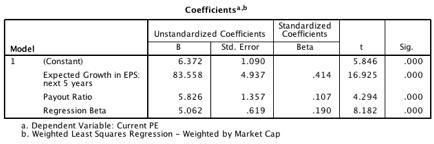
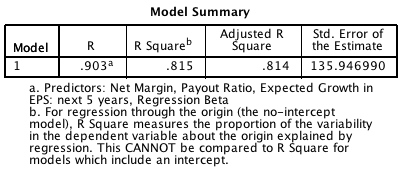
b.
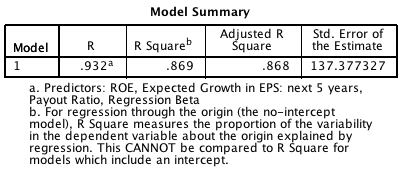
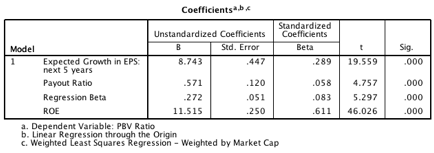
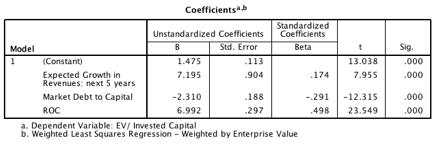
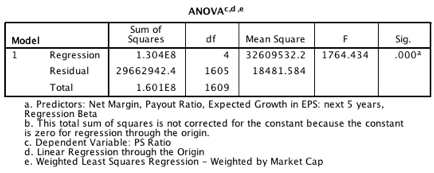
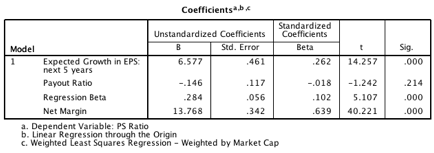
PE
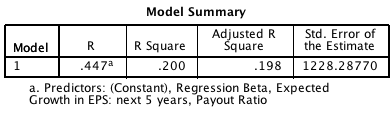
Market Regression
With
intercept
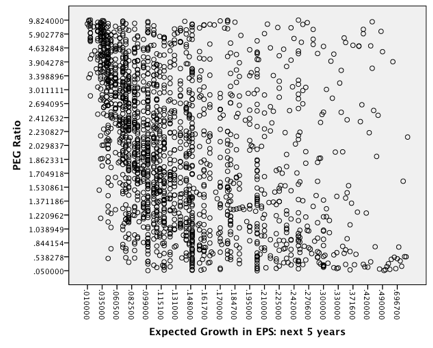
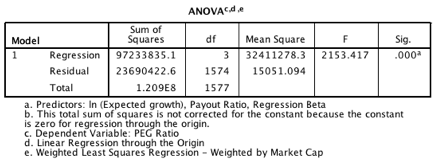
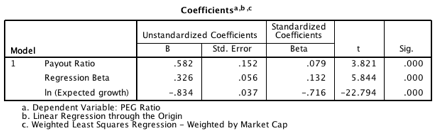
a. PEG versus Expected Growth in EPS – Scatter Plot
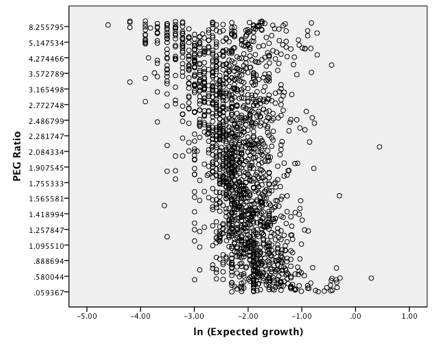
b. PEG versus ln (Expected Growth Rate)
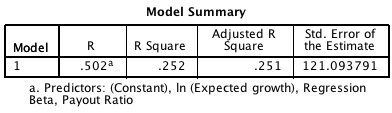
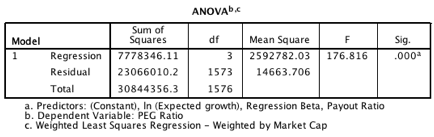
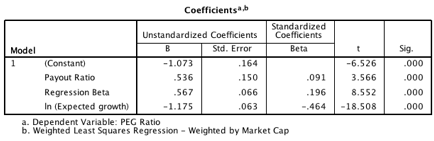
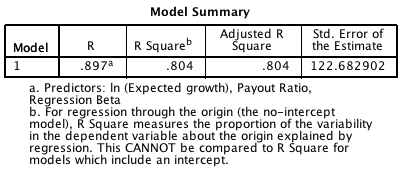
c. PEG Market Regression
With intercept
Without intercept

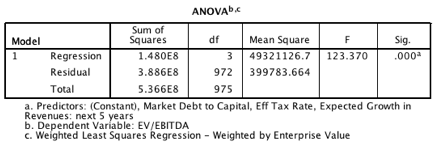
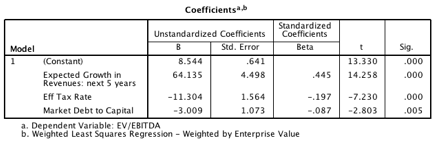

Regression with
intercept

Without intercept
With intercept
Without intercept
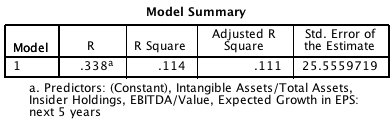
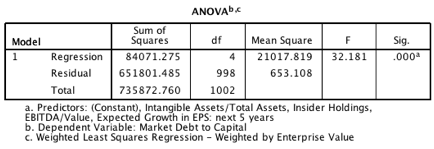
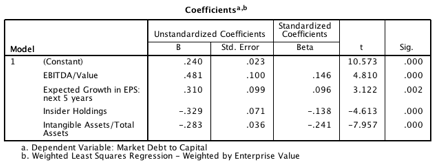
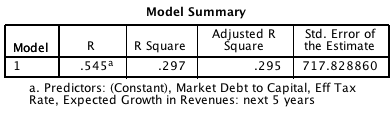
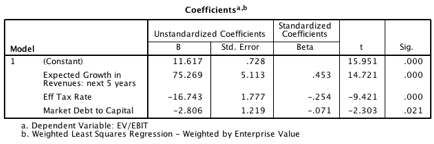
Debt to Capital Ratio (Market)