Determinants
of the PE ratio
In
Chapter 17, the fundamentals that determine multiples were extracted using a
discounted cash flow model – an equity model like the dividend discount model
for equity multiples and a firm value model for firm multiples. The price
earnings ratio, being an equity multiple, can be analyzed using an equity
valuation model. In this section, the fundamentals that determine the price
earnings ratio for a high growth firm are analyzed.
A
Discounted Cashflow Model perspective on PE ratios
In
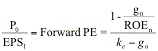
Chapter 17, we derived the PE ratio for a stable growth firm from the stable
growth dividend discount model.
![]()
If
the PE ratio is stated in terms of expected earnings in the next time period,
this can be simplified.
![]()
The PE ratio is an increasing function of
the payout ratio and the growth rate and a decreasing function of the riskiness
of the firm. In fact, we can state the payout ratio as a function of the
expected growth rate and return on equity.
Payout
ratio ![]()
The
price-earnings ratio for a high growth firm can also be related to
fundamentals. In the special case of the two-stage dividend discount model,
this relationship can be made explicit fairly simply. When a firm is expected
to be in high growth for the next n years and stable growth thereafter, the
dividend discount model can be written as follows:
where,
EPS0 = Earnings per share in year 0 (Current
year)
g
= Growth rate in the first n years
ke,hg
= Cost of equity in high growth period
ke,st
= Cost of equity in stable growth period
Payout
= Payout ratio in the first n years
gn = Growth rate after n years forever
(Stable growth rate)
Payout
Ration = Payout ratio after n years
for the stable firm
Divide both sides of the equation by EPS0.
Here again, we can substitute in the
fundamental equation for payout ratios.
where ROEhg
is the return on equity in the high growth period and ROEst is the
return on equity in stable growth:The
left hand side of the equation is the price earnings ratio. It is determined
by:
(a) Payout ratio (and return on
equity) during the high growth period and in the stable period: The PE ratio increases as the payout
ratio increases, for any given growth rate. An alternative way of stating the
same proposition is that the PE ratio increases as the return on equity increases
and decreases as the return on equity decreases.
(b) Riskiness (through the discount
rate ke): The
PE ratio becomes lower as riskiness increases.
(c) Expected growth rate in earnings,
in both the high growth and stable phases: The PE increases as the growth rate increases, in either
period.
This formula is general enough to be
applied to any firm, even one that is not paying dividends right now. In fact,
the ratio of FCFE to earnings can be substituted for the payout ratio for firms
that pay significantly less in dividends than they can afford to.
Illustration
18.1: Estimating the PE ratio for a high growth firm in the two-stage model
Assume that you have been asked to
estimate the PE ratio for a firm that has the following characteristics.
Growth rate in first five years = 25% Payout
ratio in first five years = 20%
Growth rate after five years = 8% Payout
ratio after five years = 50%
Beta = 1.0 Riskfree
rate = T.Bond Rate = 6%
Required rate of return[1] = 6% + 1(5.5%)= 11.5%
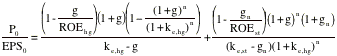
The estimated PE ratio for this firm is
28.75. Note that the returns on equity implicit in these inputs can also be
computed.
Return on equity in first 5 years ![]()
Return on equity in stable growth ![]()
Illustration
18.2: Estimating a Fundamental PE ratio for Procter and Gamble
The
following is an estimation of the appropriate PE ratio for Procter and Gamble
in May 2001. The assumptions on the growth period, growth rate and cost of
equity are identical to those used in the discounted cash flow valuation of
P&G in Chapter 13. The assumptions are summarized in Table 18.2.
Table
18.2: Summary Inputs for P& G
|
|
High
Growth Period |
Stable
Growth |
|
Length |
5 |
Forever after year 5 |
|
Cost
of Equity |
8.80% |
9.40% |
|
Expected
Growth Rate |
13.58% |
5.00% |
|
Payout
Ratio |
45.67% |
66.67% |
The
current payout ratio of 45.67% is used for the entire high growth period. After
year 5, the payout ratio is estimated based upon the expected growth rate of 5%
and a return on equity of 15% (based upon industry averages).
Stable
period payout ratio ![]()
The
price-earnings ratio can be estimated based upon these inputs.
Based
upon its fundamentals, you would expect P&G to be trading at 22.33 times
earnings. Multiplied by the current earnings per share, you get a value per
share of $66.99, which is identical to the value obtained in Chapter 13, using
the dividend discount model.
PE
Ratios and Expected Extraordinary Growth
The
PE ratio of a high growth firm is a function of the expected extraordinary
growth rate - the higher the expected growth, the higher the PE ratio for a
firm. In Illustration 18.1, for instance, the PE ratio that was estimated to be
28.75, with a growth rate of 25%, will change as that expected growth rate
changes. Figure 18.2 graphs the PE ratio as a function of the extraordinary
growth rate during the high growth period.
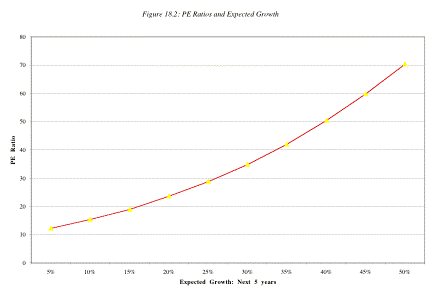
As
the firm's expected growth rate in the first five years declines from 25% to
5%, the PE ratio for the firm also decreases from 28.75 to just above 10.
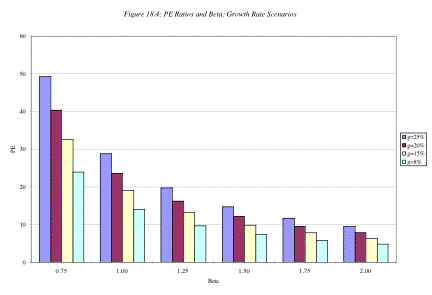
The
effect of changes in the expected growth rate varies depending upon the level
of interest rates. In Figure 18.3, the PE ratios are estimated for different
expected growth rates at four levels of riskless rates – 4%, 6%, 8% and 10%.
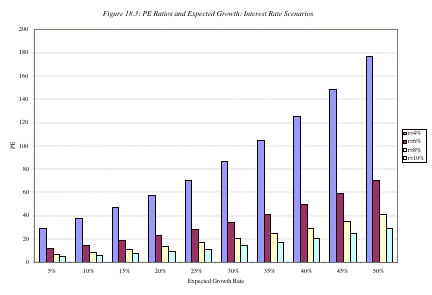
The
PE ratio is much more sensitive to changes in expected growth rates when
interest rates are low than when they are high. The reason is simple. Growth
produces cash flows in the future and the present value of these cash flows is
much smaller at high interest rates. Consequently the effect of changes in the
growth rate on the present value tend to be smaller.
There
is a possible link between this finding and how markets react to earnings
surprises from technology firms. When a firm reports earnings that are
significantly higher than expected (a positive surprise) or lower than expected
(a negative surprise), investors’ perceptions of the expected growth rate for
this firm can change concurrently, leading to a price effect. You would expect
to see much greater price reactions for a given earnings surprise, positive or
negative, in a low-interest rate environment than you would in a high-interest
rate environment.
PE
ratios and Risk
The
PE ratio is a function of the perceived risk of a firm and the effect shows up
in the cost of equity. A firm with a higher cost of equity will trade at a
lower multiple of earnings than a similar firm with a lower cost of equity.
Again, the effect of higher risk on PE
ratios can be seen using the firm in Illustration 18.1. Recall that the firm,
which has an expected growth rate of 25% for the next 5 years and 8%
thereafter, has an estimated PE ratio of 28.75, if its beta is assumed to be 1.
If you assume that the beta is 1.5, the
cost of equity increases to 14.25%, leading to a PE ratio of 14.87:
In Figure 18.4, you can see the impact of
changing the beta on the price earnings ratio for four high growth scenarios –
8%, 15%, 20% and 25% for the next 5 years.
As the beta increases, the PE ratio
decreases in all four scenarios. However, the difference between the PE ratios
across the four growth classes is lower when the beta is very high and
increases as the beta decreases. This would suggest that at very high risk
levels, a firm’s PE ratio is likely to increase more as the risk decreases than
as growth increases. For many technology firms that are viewed as both very
risky and having good growth potential, reducing risk may increase value much
more than increasing expected growth.