June 1997
This is a corporate financial analysis of Disney. I do not expect you or want you to replicate this analysis, but you can use it to get a sense of how I would answer the project questions. In doing this analysis, I was constrained because I was looking at only one firm. If you are as a group looking at a number of firms, I would strongly recommend that you try to integrate your analysis. (In other words, doing separate reports for each company is not only repetitive, but it also robs you of some interesting comparisons that you can make across these companies.) For instance, in the first part, when I have a graph on corporate governance and show Disney alone, you could show more than one firm on the same graph. In other parts, where I have tables that compare Disney to the entertainment industry, expand the tables to include all your firms. In the discussion parts, focus not only on what is unique about your firm but also on what it has in common with other companies in the group.
Finally, there will be parts of this analysis where you will have more information or less information than I do, or where the information you have from different sources is not consistent. Work with what you have. Be creative, be bold and do not let yourself be constrained by conventional wisdom. Above all, have fun. I appreciate the effort .
I. Corporate Governance Analysis
A. Management and Stockholders
Balance of Power:
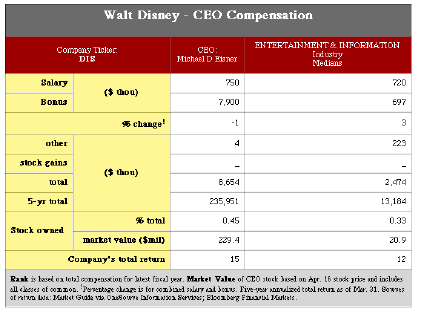
At Disney, the power clearly resides with the incumbent management, and in particular, with the CEO, Mr. Michael Eisner. This power emanates not from any stockholdings that Mr. Eisner and other top managers have - they own less than 1% of the outstanding stock - but from the fact that the board of directors is composed almost entirely of insiders and people who are close to Mr. Eisner. (See Exhibit 1 for a listing of the directors, and their relationships to Mr. Eisner or Disney.) Note that
It is interesting that both Calpers and Fortune, with different ranking mechanisms, ranked Disney’s board at the very bottom of their lists in terms of effectiveness, and independence from incumbent management.
Management power is accentuated by the fact that the stockholdings in Disney are dispersed widely, making it difficult for any one stockholder to exert pressure on managers to change their ways.
Source: Annual report; Fortune Magazine Rankings of Corporate Boards; New York Times Story on Calpers
Manifestations
The power of incumbent managment comes through in a variety of ways. In particular,
Source: Forbes.com/ceo for CEO compensation; WSJ story on Mr. Ovitz
Project Suggestion: If you are analyzing a foreign company, you might not be able to find much information on who sits on the board of directors or how much managers are paid. As a rule of thumb, the less information there is available on these matters, the more likely it is that stockholders have little or no control over the incumbent managers of the firm.
Managerial Performance
It has to be noted, in management’s favor, that Disney’s earnings and stock price performance during this period were stellar. Disney’s earnings increased from $ 816 million in 1992 to $ 1533 million in 1997, and its stock price increased from $ 35 in 1992 to $ 75.38 in June 1997. On both measures, Disney did better than other firms in the market.
Stockholder Reaction
Stockholder reaction in the early years was muted to the power that resided with incumbent management and the efforts of Mr. Eisner to stack the board. The sheer magnitude of Mr. Eisner’s compensation, and the failure of the board to hold him accountable for his actions, has lead to an increase in stockholder activism. This activism has manifested itself in the last year in the form of significant no votes on re-electing the board and as challenges to incumbent managers.
Source: WSJ report on Disney Annual Meeting
B. Firm and Financial Markets

Disney is a well-followed firm. Zacks reports at least 24 sell-side analysts who have made buy, sell or hold recommendations on the firm, providing estimates of earnings per share and future growth. While the firm provides substantial amounts of information about itself in the form of earnings reports, there is a substantial amount of information that is available about the firm from external sources. Both facts would lead us to expect less bias in the information that is available about the firm.
Source: zacks.com
C. Firms and Society

Disney, as a family-friendly firm, which wants to appeal to the widest potential audience of customers, is clearly conscious of its image. In the last two years, it has been forced to make some tough choices. On the one hand, its desire to be seen as progressive and open has lead it to actions such as granting health benefits to same-sex partners of employees. At the same time, such actions have exposed it to criticism from religious groups that view these actions as a betrayal of the "family" image that Disney tries so hard to propagate. While the boycott announced by some of the latter has not hurt Disney financially yet, the mix of businesses that Disney is in (especially the movie and broadcasting divisions) are likely to create more hard choices in the future.
Disney has also come under criticism for using child labor and accepting unsafe working conditions in some of the factories at which its toys and clothes are made overseas. After one such expose on 20/20 (a show on ABC, owned by Disney), Disney chose to terminate its contract with the company named in the expose rather than risk the negative publicity.
Finally, the number of pages in Disney’s annual report that are dedicated to the social good that it does is a good indicator of how much of a role social concerns play in Disney’s day-to-day decision making.
Source: Annual report; Various news stories;
Project Suggestion: You will not find much information on this aspect of your firm unless your firm falls into one of the extremes — for example, the tobacco firms or Exxon, or at the other extreme, companies like Levi Strauss. You can check out the annual report, and you can see how the company has responded to public or social criticism.
II. Stockholder Composition
To analyze Disney’s stockholders, we began with an analysis of who the stockholders at the firm were at the end of last year. The pie chart breaks down the stock holdings in Disney into mutual funds, other institutional investors (pension funds), individual investors and insiders.
Source: Value Line CD-ROM
 Most of these investors are still domestic investors, though they may be diversified into other markets. Finally, Disney’s stockholdings are fairly dispersed. The largest institutional investor, Investment Company of America, owns about 1.1% of the outstanding stock. The following table lists out the 10 largest stockholders in Disney.
| Holder | Shares Owned | % of Disney | % of Fund |
| Investment Company of America |
5505
|
1.10%
|
1.23%
|
| Growth Fund of America |
3852
|
0.77%
|
2.85%
|
| Vanguard Index 500 |
3638
|
0.73%
|
0.83%
|
| Fidelity Contrafund |
2123
|
0.42%
|
0.61%
|
| AMCAP Fund |
2113
|
0.42%
|
4.12%
|
| 20th Century Ultra |
1970
|
0.39%
|
0.84%
|
| Sequoia |
1561
|
0.31%
|
3.93%
|
| Vanguard Institutional Index |
1361
|
0.27%
|
0.82%
|
| Fidelity Magellan |
1300
|
0.26%
|
0.17%
|
| Vanguard Windsor |
1293
|
0.26%
|
0.58%
|
Source: Value Line
Note that Disney is not a disproportionate share of any of these fund’s total assets, suggesting that these funds are well diversified. In addition, a comparison of Disney’s insider and institutional holdings to the other entertainment firms suggests that Disney has far lower insider holdings and far greater institutional holdings than other companies in its peer group.
| Disney | Other Entertainment Companies | |
| Insider Holdings | 3.50% | 9.73% |
| Institutional Holdings | 57% | 37% |
Source: Insider and Institutional Holdings Data set on my web site
Conclusions
In conclusion, these facts suggest that:
Project Suggestion: The average stockholder may not always be the marginal stockholder. For instance, in a firm which has a significant insider holding (Microsoft, Dell etc.), the average investor may be the owner/manager of the company (Gates, Dell etc.), but the marginal investor (who is the investor who trades on a regular basis and sets prices) may be a large institutional investor or individual.
III. Risk Profile
Overall Risk Profile
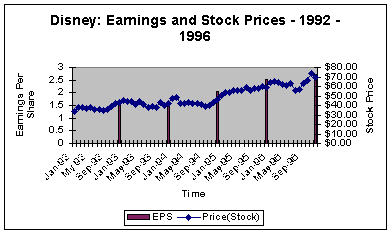 To analyze the risk profile for Disney, we begin with a plot of Disney monthly stock prices and quarterly earnings over the last 5 years. Both Disney’s stock prices and earnings have been on an upward path over the period, though there is considerable volatility in the stock prices, as evidenced by the standard deviation in stock prices, which was 21.26% on an annualized basis during this period.
Source: Bloomberg for prices over last 5 years and annual earnings per share.
A Market Analysis of Risk and Return
To analyze how much of this volatility can be attributed to market forces, we ran a regression of Disney stock prices against the S&P 500:
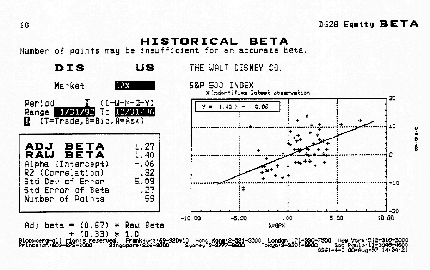
Source: Bloomberg Beta Page
In terms of the diagnostics on this regression, we concluded the following:
(a) Slope of the regression = 1.40. This is Disney's beta, based on returns from 1992 to 1996. Using a different time period for the regression or different return intervals (weekly or daily) for the same period can result in a different beta.
(b) Intercept of the regression = -0.01%. This is a measure of Disney's performance, when it is compared with Rf (1-b). The monthly risk-free rate (since the returns used in the regression are monthly returns) between 1992 and 1996 averaged 0.4%, resulting in the following estimate for the performance:
Rf (1-b) = 0.4% (1-1.40) = -0.16%
Intercept - Rf (1-b) =-0.01% - (-0.16%) = 0.15%
This analysis suggests that Disney performed 0.15% better than expected, when expectations are based on the CAPM, on a monthly basis between January 1992 and December 1996. This results in an annualized excess return of approximately 1.81%.
Annualized Excess Return = (1 + Monthly Excess Return)12 - 1
= 1.001512 -1 = 1.0181 - 1 = 0.0181 or 1.81%
By this measure of performance, Disney did slightly better than expected during the period of the regression. Note, however, that this does not imply that Dsiney would be a good investment looking forward. It also does not provide a breakdown of how much of this excess return can be attributed to ‘industry-wide’ effects, and how much is specific to the firm. To make that breakdown, the excess returns would have to be computed over the same period for other firms in the entertainment industry and compared with Disney’s excess return. The difference would be then attributable to firm-specific actions. In this case, for instance, the average annualized excess return on other entertainment firms between 1992 and 1996 was 3.5%, suggesting that the firm-specific component of performance for Disney is actually -1.7%. (Firm-specific Jensen’s alpha = 1.8% - 3.5%)
Source: The monthly riskfree rate can be obtained by adding up the T.Bill rates each year for the last 5 years (available in the Historical returns dataset on my web site), averaging them out, and then dividing by 5.For 1993-97, you can use 0.4% a month.
(c) R squared of the regression = 32.41%. This statistic suggests that 32.41% of the risk (variance) in Disney comes from market sources (interest rate risk, inflation risk etc.), and that the balance of 67.59% of the risk comes from firm-specific components. The latter risk should be diversifiable, and therefore unrewarded in the CAPM.
We also compared Disney’s regression statistics to those of the market over the same period, and came up with the following estimates:
| Disney | Entertainment Companies | |
| Beta | 1.40 | 0.91 |
| Jensen’s Alpha | 1.81% | 3.51% |
| R Squared of Regression | 32% | 47% |
Source: Industry Regression Statistics (My web site/new stuff)
Disney seems riskier than the comparable firms, and has done less well these firms in recent periods. It also gets a smaller portion of its risk from market factors (which are not diversifiable).
Project Suggestion: If you are comparing these statistics across multiple companies, you can consign the scatter plot (from Bloomberg or your own regression to the end of the report, and focus on only the output from the regression in this part of the report. Thus, the table shown above for Disney and entertainment firms can be expanded to include the other companies that you are analyzing.
A Bottom-up Beta Estimate
While the regression of Disney on the S&P 500 suggests a beta of 1.40, I would be concerned about using this beta because of
To estimate a bottom-up beta for Disney, we broke it up into five different businesses and estimated the betas for each business based upon comparable firms. The table below provides the business mix, comparable firms used and the weights attached to each business:
| Business | Estimated Value | Comparable Firms | Unlevered Beta | Division Weight | Weight*Beta |
| Creative Content |
$ 22,167
|
Motion Picture and TV program producers |
1.25
|
|
|
| Retailing |
$ 2,217
|
High End Specialty Retailers |
1.5
|
|
|
| Broadcasting |
$ 18,842
|
TV Broadcasting companies |
0.9
|
|
|
| Theme Parks |
$ 16,625
|
Theme Park and Entertainment Complexes |
1.1
|
|
|
| Real Estate |
$ 2,217
|
REITs specializing in hotel and vacation properties |
0.7
|
|
|
| Firm |
$ 62,068
|
|
|
In the first column, we list the businesses that Disney is involved in. In the second, we list the estimated value of each business to Disney, based upon the operating income (EBIT) of each business and an average multiple of EBIT (based upon comparable firms) for each business. In the third, we report the unlevered beta of comparable companies in each business, obtained by averaging out the betas of firms in each of the businesses and unlevering at their average debt/equity ratio. In the fourth column, we report the companies we used as comparable firms and in the last two columns we compute the weighted average beta. The unlevered beta, based upon the bottom-up calculation, for Disney is 1.09.
Project Suggestion: When estimating the bottom-up beta, try not to disaggregate too much or you will have trouble finding comparable firm betas. If your firm reports operating income by segment, use that to weight the unlevered betas. If not, use revenues.
To get Disney’s levered beta, we used the current estimated market values of equity and debt.
Market Value of Equity = Share Price * Number of Shares = 75.38 * 675.13 = 50.88 Billion
To get the market value of debt, we used the book value of debt of $ 12.342 billion, the interest expenses of $ 479 million and the face-value weighted average maturity of 3 years, in conjunction with a current cost of borrowing of 7.50% (see debt section below) to arrive at an estimated market value of debt of $ 11.18 billion.
Source: The face-value weighted maturity comes from the footnotes to the balance sheet.
Estimated Market Value of Debt = 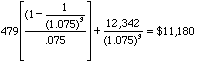
Using these estimated market values for debt and equity, we estimated a debt/equity ratio of 21.97% for Disney as a company, and used it in conjunction with the bottom-up unlevered beta of 1.09 to estimate an unlevered beta of 1.25
Levered Beta for Disney = 1.09 ( 1 + (1-.36) (11.18/50.88)) = 1.25
Project Suggestion: When you have lots of bonds outstanding, aggregate the debt and interest expenses as we did for Disney, and compute the market value once rather than several times. If you have convertible debt which is traded, this same approach can be used to break the convertible debt into debt and equity components. With preferred stock, use the market value of the preferred and keep it as a separate component for the cost of capital, with the preferred yield being the cost of preferred stock. Finally, if you are going to capitalize operating leases, add the present value of these leases (at the cost of debt) to the market value of debt.
From Betas to Costs of Equity
To get from the beta to the cost of equity, we needed two other inputs. For the riskfree rate, we used a long term treasury bond rate (which at the time of the analysis was 7%). For the risk premium we will use the geometric historical risk premium for stocks over long term treasury bonds of 5.5%.
Expected Return = 7% + 1.25 (5.5%) = 13.85%
Using the expected return: This is the return that potential investors would require as a rate of return for investing in Disney stock, and it is also the cost of equity for Disney.
To estimate the levered beta by division, we used the same debt/equity ratio for all divisions except real estate, which raises its own debt based upon its properties.
| Business | Unlevered Beta | D/E Ratio | Levered Beta | Riskfree Rate | Risk Premium | Cost of Equity |
| Creative Content |
|
20.92%
|
|
|
|
14.80%
|
| Retailing |
|
20.92%
|
|
|
|
16.35%
|
| Broadcasting |
|
20.92%
|
|
|
|
12.61%
|
| Theme Parks |
|
20.92%
|
|
|
|
13.92%
|
| Real Estate |
|
50.00%
|
|
|
|
12.08%
|
| Disney |
|
21.97%
|
|
|
|
13.85%
|
Using the same riskfree rate of 7% (based upon the long term treasury bond rate) and a risk premium of 5.5% (based upon historical data) yields us the costs of equity by division.
Source: Use the latest long-term government bond rate as your riskless rate, and a 5.5% premium (if it is a US stock, or the country premium (based upon rating) if it is a foreign stock.
Disney’s Cost of Debt
To estimate Disney’s cost of debt, we obtained the current bond rating of the company. Standard and Poor’s assigns a rating of AA to Disney’s traded debt. Based upon the long term treasury bond rate of 7% and an estimated default spread of 0.50%, we estimate a pre-tax cost of borrowing of 7.50%. The after-tax cost of debt for Disney reflects the tax savings accruing to interest:
After-tax Cost of Debt = 7.50% (1 - .36) = 4.80%
We will also assume that all of Disney’s divisions face the same cost of borrowing.
Source: Bloomberg corporate bond page for Disney. If it does not exist, use a synthetic rating.
Project Suggestion: If your company has multiple bonds outstanding, it might also have multiple ratings. Use the rating on a recently issued straight bond. If you cannot find a rating, use the synthetic rating spreadsheet to estimate a rating. If you are capitalizing operating leases, be consistent, and treat these expenses like interest expenses.
Disney’s Weights for Debt and Equity
Using the market values of debt and equity, estimated earlier in the section on levered betas to be $ 50.88 billion for equity and $ 11.18 billion for debt, we estimate the following weights for debt and equity in the capital structure calculation:
Equity Ratio = 50.88/62.06 = 82%
Debt Ratio = 11.18 /62.06 = 18%
Disney’s Cost of Capital
Having estimated a cost of equity of 13.85% and an after-tax cost of debt of 4.80%, the cost of capital for Disney can be computed as follows:
Cost of Capital = 13.85% (0.82) + 4.80% (0.18) = 12.22%
The divisional costs of capital can also be estimated similarly, using the divisional costs of equity and the same debt ratio for all divisions except for real estate.
| Business |
|
|
|
|
|
| Creative Content |
|
|
|
|
|
| Retailing |
|
|
|
|
|
| Broadcasting |
|
|
|
|
|
| Theme Parks |
|
|
|
|
|
| Real Estate |
|
|
|
|
|
| Disney |
|
|
|
|
|
The costs of capital for the divisions range from a high of 14.36% for retailing to 9.65% for real estate.
Relevance of Costs of Equity and Capital
The costs of equity and capital become hurdle rates for Disney as a company, with different rates applying for different divisions. In using these rates,
IV. Investment Return Analysis
A Typical Project
Given the diversity of Disney’s business mix, it is difficult to identify one typical project. Instead, we will identify the likely characteristics of projects in each of Disney’s divisions:
| Business | Project Cash Flow Characteristics |
| Creative Content | Projects are likely to
|
| Retailing | Projects are likely to be
1. medium term (tied to store life) 2. primarily in dollars (most of the stores are still in the United States) 3. cyclical |
| Broadcasting | Projects are likely to be
1. short term 2. primarily in dollars, though foreign component is growing 3. driven by advertising revenues and show success |
| Theme Parks | Projects are likely to be
|
| Real Estate | Projects are likely to be
|
Project Suggestion: This might be difficult to do for companies which do not have typical projects. Give it your best shot. If a firm has multiple divisions, try to look at each division separately.
A. Measuring Past Returns
To measure returns on Disney’s existing projects, we begin with a couple of assumptions. We assume that the current earnings of the firm are earnings attributable to existing projects. Consequently, we adjust earnings by adding back one-time charges and amortization of goodwill (on the Capital Cities acquisition). We also assume that the current book value of assets and equity reflect the current capital and equity invested in existing projects. Using the net income and book value of equity, we compute a return on equity of:
Return on Equity = Net Income1996 / Average BV of Equity for 1995 and 1996 = $2,836 million / $ 11,368 million = 24.95%
The average book value of equity was obtained by adding up the book values of equity for 1995 and 1996 and dividing by two.
Using the after-tax operating income and book value of capital, we estimate a return on capital of
Return on Capital = EBIT1996 (1-t)/ Average BV of Capital from 1995 to 1996 = $5,559 (1-.36)/ (19,031) = 18.69%
[Book value of capital = Book Value of Equity + Book Value of Debt; the average is obtained by summing up the book values for the two years and dividing by two.]
Both the net income and earnings before interest and taxes were cleansed of one-time charges and any extraordinary items.
Project Suggestion: For book value of equity, use only common equity. If your company’s book value of equity, do not compute the return on equity, since it is meaningless. You can also use the book value of equity and capital from the end of the last year to compute returns on equity and capital. The more your company has grown in the last year, the more I would be inclined towards using the average.
B. Evaluation Of Past Returns
To evaluate whether these returns measure up to requirements, we compare the return on equity to the cost of equity from the previous section.
Return on Equity = 24.95%
Cost of Equity = 13.85%
Equity Return Spread = 24.95% - 13.85% = 11.10%
This spread, when multiplied by the book value of equity, yields a measure of the surplus value created by existing projects (called the Equity EVA).
Equity EVA = (Return on Equity — Cost of Equity) (BV of Equity) = (.2495 — 1385) ($11,368 million) = $1,262 million
A similar analysis, comparing return on capital to cost of capital, yields the following numbers.
Return on Capital = 18.69%
Cost of Capital = 12.22%
EVA = (.1869 — .1222) ( 19,031 million) = $1,232 million
On both measures, it looks like Disney is creating about $1.2 billion in surplus value each year because of the excess returns it makes on its existing projects. While we have a measure of operating income at the division level, we do not have a breakdown of book value at the division level. If we did, we could compute the returns on capital, on a division level, and compare them to costs of capital, on a division level, to estimate divisional EVA.
Finally, we compare Disney’s equity and firm EVA to those created by entertainment firms as a whole in the most recent year in the table below:
| Disney | Entertainment Firms | |
| Equity EVA | $1,262 million | - $ 52 million |
| Firm EVA | $1,232 million | - $ 40 million |
Source: My web site/datasets/EVA
In contrast to other entertainment firms, Disney is creating significant surplus value from existing projects.
C. Assessments for the Future
We believe that the theme parks, creative content, retailing and real estate divisions are likely to continue generating surplus value into the future, because of several barriers to entry, including:
Project Suggestion: This is an extremely subjective analysis, but note that no one really knows the answers to these questions. Again, bring to bear what you know about the company, its products, its management and the competitors to give it your best shot.
V. Capital Structure Choices
Current Financing Mix
Disney currently has the following debt on its books:
|
|
|
|
|
| Commercial Paper | $4,185 million | 5.5% | 1 |
| Debentures | $4,399 million | 6.6% | 2-6 years |
| Dual Currency and Foreign Notes | $1,987 million | 5.4% | 1-4 years |
| Senior Participating Notes | $ 1,099 million | 6.3% | 3-4 years |
| Other | $ 672 million | 5.6% | 1-15 years |
| Total | $ 12,342 million | Approximately 3 years |
Source: Footnotes to Balance Sheet on Borrowings
Disney’s commercial paper reflects the money borrowed by Disney in its acquisition of Capital Cities, and Disney has replaced almost $ 4 bilion of its original commercial paper borrowing with longer term notes. The Company foreign currency notes are mostly in three currencies — British Pounds ( $ 520 million), Japanese Yen ( $1.4 billion) and Italian Lira ( $ 190 million).
The company’s senior debt is rated AA, and the market interest rate on AA bonds at the time of this analysis is 7.50%. Disney’s medium term notes were trading at a yield to maturity of roughly 6.9%. Given that these notes are shorter term, we will continue to use the 7.50% as our cost of debt.
Project Suggestion: Some companies provide more information than other companies on their borrowing. If you are working with a foreign company, you might be able to get far less information on this component.
Trade Off on Debt versus Equity
Looking at the advantages and disadvantages of debt, and Disney’s specific characteristics yields the following:
| Factor | Disney |
| Tax Benefit | Disney has a marginal tax rate of about 40%. It has an effective tax rate of 43.58%. |
| Added Discipline of Debt | Disney is a widely held firm. While institutional stockholders own a significant percentage of the firm, no individual stockholder or institution is large enough to have much say in management. The firm has significant cash flows and should gain from the use of debt. |
| Bankruptcy Risk | Some of Disney’s earnings are volatile, but a significant portion of the cash flows are stable (especially cash flows from theme parks). The bankruptcy risk should be low, given this factor and the size of the company |
| Agency Costs | The agency costs are likely to be large for borrowings by the creative content and broadcasting divisions, where it is difficult to track the funds. It is likely to be smaller in the real estate, retailing and theme park divisions. |
| Future Flexibility | The need for financing flexibility is increasing as the media business changes technologically and becomes more global. |
Project Suggestion: This is a subjective analysis and is meant to be so. If you are comparing across companies, use this table to compare the companies on each of these factors. You can then make statements about which of the companies should have the highest debt ratio and which should have the lowest debt ratio.
A Qualitative Judgment
Based upon this trade off, we would expect Disney to have significant debt capacity. It has potentially large benefits from debt — tax benefits and added discipline — and has the cash flows to sustain the debt without significant bankruptcy and agency costs. Disney’s current debt ratio is probably too low.
VI. Optimal Capital Structure
Current Cost of Capital / Financing Mix
To estimate the current cost of capital, we used the market value of equity and estimated market value of debt from the earlier section on hurdle rates. Using the market value of equity of $ 50.88 billion, the market value of debt of $ 11.18 billion, the cost of equity of 13.85% (based upon the bottom-up beta) and the after-tax cost of borrowing of 4.80%, we estimate a cost of capital as follows:
Cost of Capital = 13.85%(.82)+4.80%(.18) = 12.22%
Project Suggestion: Since the optimal capital structure analysis forces you to pick between only debt and equity, those of you who have preferred stock in your capital structures will have to do some fancy footwork at this stage. The simplest way of dealing with this is to calculate the cost of capital without preferred stock at this stage. To be consistent then, when you calculate the EBIT to use in the optimal capital structure analysis below, use (EBIT — Preferred Dividends).
Costs of Capital at Different Financing Mixes
We estimated the costs of equity and debt at different debt ratios — using betas for costs of equity and estimated ratings for costs of debt.
| Debt Ratio | Cost of Equity | AT Cost of Debt | Cost of Capital |
| 0.00% | 13.00% | 4.61% | 13.00% |
| 10.00% | 13.43% | 4.61% | 12.55% |
| 20.00% | 13.96% | 4.99% | 12.17% |
| 30.00% | 14.65% | 5.28% | 11.84% |
| 40.00% | 15.56% | 5.76% | 11.64% |
| 50.00% | 16.85% | 6.56% | 11.70% |
| 60.00% | 18.77% | 7.68% | 12.11% |
| 70.00% | 21.97% | 7.68% | 11.97% |
| 80.00% | 28.95% | 7.97% | 12.17% |
| 90.00% | 52.14% | 9.42% | 13.69% |
Based upon the objective of minimizing the cost of capital, the optimal debt ratio for Disney was 40%.
Project Suggestion: If you are analyzing multiple companies, just show the cost of capital (and not the costs of debt and equity) for each company at each debt ratio in this table (instead of having a table for each company). Then highlight the optimal cost of capital box for each company separately. You need not include the capital structure spreadsheet output in your project.
Firm Value at Optimal
To estimate firm value at the optimal debt, we estimated the dollar savings we would have from moving from the current cost of capital of 12.22% to the cost of capital at the optimal (11.64%), and converted it into present value terms:
Firm Value before the change = 50,888+11,180= $ 62,068
WACCb = 12.22% Annual Cost = $62,068 *12.22%= $7,583 million
WACCa = 11.64% Annual Cost = $62,068 *11.64% = $7,226 million
D WACC = 0.58% Change in Annual Cost = $ 357 million
Assuming an implied growth rate (of 7.13%) in firm value over time,
Implied Growth Rate
The implied growth rate is based upon the assumption that the market value of Disney as a company reflects a market expectation of future growth. To estimate it, we used the following perpetual growth formula
Firm value Today =FCFF(1+g)/(WACC-g)
Substituting today’s market value for Disney as a firm (debt + equity) of $ 62,068 million, the free cash flow to the firm of $3,255 million and the current cost of capital of 12.22%, we solved for the expected growth rate of 7.13%.
In summary, we are arguing that increasing debt ratio to the optimal will increase the stock price approximately $12.55 per share, which translates into a 16.65 % change in the current stock price of $ 75.38. This is also based upon the assumption that the stock repurchase will occur at the higher price (thus, allowing investors who sell their stock back to the firm to also share in the spoils).
Project Suggestion: If you are comparing the optimal debt ratios of two or more firms in a sector, estimate EBITDA as a percentage of firm value for each firm. The magnitude of this ratio will be highly correlated with the optimal debt ratio.
Constraints
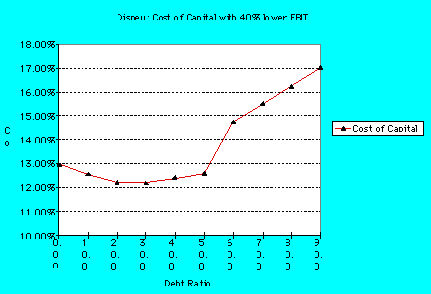
I. Operating Income Variability: What If Analysis
We examined the sensitivity of the optimal debt ratio to changes in the operating income. Looking at the last two decades of operating income changes, we estimated a standard deviation in operating income of 39%. In conjunction with Disney’s worst year of operating income (-26%) and the behavior of its operating income during the last two recessions (-22% in 1990-91 recession and no change duringthe 1980-82 recession), this lead us to use a worst case scenario drop in the operating income of 40%. The optimal debt ratio with this lower operating income was between 20 and 30%.
 II. Rating Constraints
To provide a cushion against downside risk, we also considered a rating constraint of BBB or higher. Using the same table as the one used for the optimal debt ratio, we obtained the following ratings at different debt ratios:

While the unconstrained optimal debt ratio for Disney is 40%, the optimal debt ratio is 30%, when we introduce a BBB constraint.
In Summary
Both the operating income worst-case scenario and the rating constraints suggest to us that Disney’s excess debt capacity is not an artifact of just a good operating year. The analyses present a powerful argument that Disney is under levered and should use more debt in its financing mix.
Sector Analysis
We did the sector analysis in two parts. In the first part, we compared Disney’s debt ratio to its largest competitors in the entertainment industry.
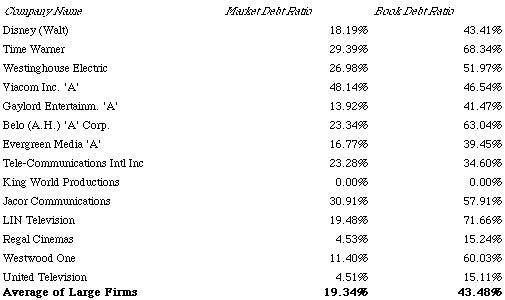
Source: Bloomberg using RV screen or Value Line
Disney’s debt ratio is pretty comparable to the averages on both a book value and a market value basis. Since these companies vary significantly on fundamentals, we ran a regression of debt ratios against fundamentals for all entertainment firms (about 30) and arrived at the following regression:
Debt Ratio = - 0.1067 + 0.69 Tax Rate + 0.61 EBITDA/Value - 0.07 sOI
(0.90) (2.58) (2.21) (0.60)
The R squared of the regression is 27.16%. This regression can be used to arrive at a predicted value for Disney of:
Predicted Debt Ratio = - 0.1067 + 0.69 (.4358) + 0.61 (.0837) - 0.07 (.2257) = .2314
Based upon the debt ratios of other firms in the entertainment industry, Disney should have a market value debt ratio of 23.14%.
Project Suggestion: If you are doing this for a number of firms in the same sector, you can do one regression and apply it to all the firms to get predicted debt ratios for the firms. You do not need to use the same or all of the variables that I used. Work with what you can get information on, and think about the variables in the trade off to decide what variables you need to measure bankruptcy cost, agency costs and tax benefits.
Market Analysis
This analysis was extended to cover all firms listed on the US markets, to yield the following regression of debt ratio against the variance in market prices (as a proxy for bankruptcy risk), the percent of shares that are closely held (as a proxy for debt as a disciplinary mechanism), capital expenditures as a percent of total assets (as a proxy for the need for flexibility) and free cash flows as a percent of the market value of the firm (as a proxy for the cash flow potential of the firm).
DFR =0.2370- 0.1854 PRVAR +.1407 CLSH + 1.3959 CPXF -.6483 FCP
(6.06a) (1.96b) (1.05a) (5.73a) (3.89a)
Plugging in the values for these variables for Disney yields a predicted debt ratio of:
Disney’s Predicted Debt Ratio =0.2370- 0.1854 ( .04 ) +.1407 (.04) + 1.3959( .06) -.6483 ( .03 ) =29.95%
Based upon the debt ratios of other firms in the market, Disney should have a market value debt ratio of 29.95%.
Project Suggestion: It is difficult to get the information you need to run a market regression, unless you have access to an updated database. You can skip this part of the analysis for your firm, and just compare your firm's debt ratio to the average for the market (which is available on my web site under data sets).
Summarizing the Debt Ratio Analysis
Looking at the analysis, we have four estimates of the optimal debt ratio — 40% from the unconstrained optimal, 20-30% from the constrained optimal (with ratings and operating income constraints), 23.14% from the sector-based relative analysis and 29.95% from the market —based relative analysis. We do not believe, given Disney’s unique business mix and characteristics, that the sector-based analysis should carry much weight. We also accept the need for reasonable ratings and operating income constraints, which leaves us with the conclusion that Disney has excess debt capacity and a "recommended" debt ratio of 30%. If Disney does move to this debt ratio, it will be in line with the debt ratios of other firms in the market, with similar characteristics.
VII. Mechanics of Moving to the Optimal
A Path to the Optimal
The Right Financing For Disney
Intuitive Analysis
| Business | Project Cash Flow Characteristics | Type of Financing |
| Creative Content | Projects are likely to
|
Debt should be
|
| Retailing | Projects are likely to be
1. medium term (tied to store life) 2. primarily in dollars (most of the stores are still in the United States) 3. cyclical |
Debt should be in the form of operating leases. |
| Broadcasting | Projects are likely to be
1. short term 2. primarily in dollars, though foreign component is growing 3. driven by advertising revenues and show success |
Debt should be
|
| Theme Parks | Projects are likely to be
|
Debt should be
|
| Real Estate | Projects are likely to be
|
Debt should be
(Mortgage Bonds) |
A More Quantitative Analysis
To provide a more quantitative estimate of the right financing characteristics, we regressed changes in Disney’s hisorical operating income and firm value against four macro-economic variables — interest rates, inflation rates, the weighted dollar and real GNP. The following table summarizes our results and conclusions:
|
|
|
|
| Long Term Interest Rates | D FV = 0.22 - 7.43 ( D Interest Rates)
(3.09) (1.69) D OI = 0.31 - 4.99 ( D Interest Rates) (2.90) (0.78) |
Both firm value and operating income are sensitive to interest rate changes. The firm value regression suggests that the duration of Disney’s assets is roughly 7.5 years. The operating income regression yields a lower estimate. |
| Real GNP | D FV = 0.31 + 1.71 ( GNP Growth)
(2.43) (0.45) D OI= 0.17 + 4.06 ( GNP Growth) (1.04) (0.80) |
Disney is not a very cyclical firm. While is operating income is marginally cyclical, its firm value shows little evidence of being affected by overall economic growth. |
| Inflation Rates | D FV = 0.2 - 0.22 (D Inflation Rate)
(3.36) (0.05) D OI = 0.32 + 10.51 (D Inflation Rate) (3.61) (2.27) |
Disney’s firm value is not affected much by what happens to inflation rates, but its operating income tends to move with inflation, reflecting Disney’s pricing power. This would suggest that some of Disney’s debt be floating rate debt. |
| Weighted Dollar | D FV = 0.26 - 1.01 (D Dollar)
(3.35) (0.98) D OI = 0.26 - 3.03 (D Dollar) (3.14) (2.59) |
Disney’s operating income, again, is more negatively affected by a stronger dollar than the firm value. This would again suggest that some of Disney’s debt be in a foreign currency. |
D FV = Change in Firm Value D OI = Change in Operating Income
Project Suggestions: The coefficients on these regressions are likely to be all over the place. If they are, look at the averages across firms in your group to get a sense of what financing mix is right for your type of firm. The data on the macro economic variables is available on the web under datasets. (macro.xls)
Overall Recommendations on Financing Mix
Based upon our analysis of Disney, we would recommend that Disney issued debt
Disney’s current debt satisfies the last two conditions, but is much too short term (with an average maturity of only 3 years). As the commercial paper gets refinanced, Disney should issue longer term debt.
VIII. Dividend Policy: The Trade Off
Current Dividend Policy
Disney has used both dividends and stock buybacks over the last 5 years to return cash to its owners. The following table summarizes the earnings, dividends and stock buybacks at Disney from 1992 to 1996:
|
|
|
|
|
|
|
| Dividends |
|
|
|
|
|
| + Equity Repurchases |
|
|
|
|
|
| = Cash to Stockholders |
|
|
|
|
|
Source: Statements of Cash Flows (Bloomberg Financial Analysis)
Disney’s dividend yield is relatively modest. Based upon its current price of $ 75.375, its dividend yield is only 0.67%. It pays out 19.73% of its earnings as dividends. In the following table, we compare Disney’s dividend yield and payout to that of the entertainment industry:
| Disney | Entertainment Companies | |
| Dividend Yield | 0.67% | 0.59% |
| Dividend Payout | 19.73% | 35.84% |
Source: My web site/ datasets/dividend fundamentals
Disney pays out less of its earnings as dividends than the typical entertainment company, but has a higher dividend yield than other entertainment firms.
Trade Offs on Dividend Policy
| Factor | Implications for Disney |
| Stockholder Tax Preferences | Given its history as a stock with low dividend yields, stockholders are much more likely to be attracted to capital gains than dividends.
Equity Buybacks |
| Information Effects and Signaling Incentives | Disney is one of the more heavily followed stocks in the United States. It should not have to increase dividends to attract attention or send signals about future cash flows. |
| Effect on Flexibility | The technological changes in the media and entertainment business and uncertainty about global expansion needs increase the need for flexibility and are likely to work against paying more in dividends. |
| Bond Covenants and Ratings Agency Concerns | Neither is likely to be a serious impediment to Disney raising dividends. |
Overall, the factors suggest that Disney, if it wants to return cash to its stockholders, would be better off returning cash to stockholders in the form of stock buybacks rather than dividends.
IX. Dividend Policy: A Framework
How much could Disney have paid as Dividends between 1992 and 1996?
To evaluate how much Disney could have paid out in dividends between 1992 and 1996, we estimated the free cash flows to equity at Disney each year. The following table summarizes our results:
| Year |
|
|
|
|
|
1992
|
|
|
|
|
|
1993
|
|
|
|
|
|
1994
|
|
|
|
|
|
1995
|
|
|
|
|
|
1996
|
|
|
|
|
| Average |
|
|
|
|
Source: Bloomberg Financial Analysis — Statements of Cash Flows
Disney’s average debt ratio of 23.81% was used to compute the free cash flow to equity each year during the period. Based upon this analysis, Disney could have returned $ 793 million in cash to its stockholders, either in the form of dividends or equity buybacks during this period.
Project Suggestion: The debt ratio that should be used for this section should be the average debt to capital ratio during the period of your analysis.
How much did Disney actually pay in Dividends between 1992 and 1996?
We then looked at how much Disney returned in the form of dividends and stock buybacks each year from 1992 to 1996, and the results are summarized below:
| Year | FCFE | Dividends + Stock Buybacks |
| 1992 | $563 | $105 |
| 1993 | $722 | $160 |
| 1994 | $1,139 | $724 |
| 1995 | $1,261 | $529 |
| 1996 | $278 | $733 |
| Average | $793 | $450 |
On average, Disney returned $ 450 million in cash, in the form of dividends and stock buybacks, each year between 1992 and 1996, about $ 343 million less each year than they could have afforded to pay out.
How much do we trust management at Disney?
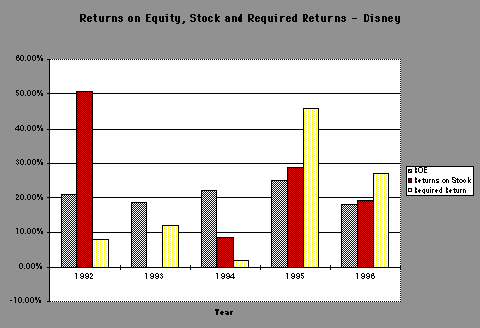
To make a judgment on how much we would trust Disney’s management to use this cash wisely, and how willing stockholders would be to allow this policy of paying less in dividends than is available in free cash flow to equity, to continue, we scored incumbent management on three dimensions, each of which we have analyzed earlier in this report. The first dimension is corporate governance, where we look at whether incumbent management has been willing to listen to stockholders and put their interests above their own. On this test, Disney’s top management fails the test. The second dimension is stock price performance, where we look at the performance of Disney stock, relative to its peer group and the market, after adjusting for risk. On this measure, Disney has delivered excess returns of about 1.81% a year between 1992 and 1996 to its stockholders and has earned itself some leeway on dividend policy. The final dimension is investment policy, where we analyze whether the investments Disney has made historically have measured up in terms of delivering returns to equity investors that exceed the required rate of return. Again, as our earlier analysis of return on equity and EVA shows, Disney passes the test with a return on equity of almost 24.95%. The year-by-year results on the first two tests are summarized in the graph.
 Comparison to the Peer Group
In comparing Disney’s dividend policy to its peer group, we analyze the dividend yields and payout ratios of comparable firms in 1997 , as shown in in the table below:
Payout Ratios and Dividend Yields: Entertainment Firms
| Company Name |
|
|
|
|
|
| Belo (A.H.). |
|
|
|
|
|
| King World |
|
|
|
|
|
| Gaylord 'A' |
|
|
|
|
|
| Disney (Walt) |
|
|
|
|
|
| Chris-Craft |
|
|
|
|
|
| Clear Channel |
|
|
|
|
|
| Viacom 'A' |
|
|
|
|
|
| Westinghouse |
|
|
|
|
|
| Average |
|
|
|
|
Source: Value Line
The earnings predictability estimates and forecasted growth rates are from Value Line; we would expect companies with less predictable earnings and higher expected growth rates to have lower earnings to have lower dividend yields and payout ratios than firms with more predictable earnings and lower growth. The problem with this comparison is that there is very little variability in dividend policy across firms in this group.They all have low dividend yields and payout ratios, with Disney’s yield and payout ratio being close to the average for the industry. We did try regressing dividend yield and payout ratios against expected growth rates:
Dividend Payout Ratio = 0.24 - 0.89 (Expected growth rate) R2 = 21.37%
(1.28)
Dividend Yield = 0.0107 - 0.043 (Expected growth rate) R2 = 33.65%
(1.74)
Using Disney’s expected growth rate of 15% in these regressions yields the following predicted values for the dividend measures.
Predicted Dividend Payout for Home Depot = 0.24 - 0.89 (.15)= 0.1066 or 10.66%
Predicted Dividend Yield for Home Depot = 0.0107 - 0.043(.15)= 0.0044 or .44%
These predicted values suggest that, given its expected growth rate, Disney’s payout ratio of 19.73% and dividend yield of 0.67% are too high, relative to other firms in the sector.
Comparison to the Market
Using data from 1996, we regressed dividend yields and payout ratios against all of these variables and arrived at the following regression equations.
PAYOUT = 0.3410 - 0.2109 BETA + 0.0000033 MKTCAP + 0.0274 DBTRATIO + 0.1825 ROE - 0.0167 NCEX/TA R2 = 7.04%
YIELD = 0.0189 - 0.0121 BETA + 0.00000016 MKTCAP + 0.0056 DBTRATIO + 0.0094 ROE - 0.0028 NCEX/TA R2 =10.02 %
where BETA = Beta of the stock
MKTCAP = Market Value of Equity + Book Value of Debt
DBTRATIO = Book Value of Debt / MKTCAP
ROE = Return on Equity in 1996
NCEX/TA = (Capital Expenditures - Depreciation) / Total Assets
The regression does not have very good explanatory power, however, since it explains only 7% to 10% of the differences in dividend measures.
Substituting into the regression equation for the dividend payout ratio, we predicted the following payout ratio for Disney:
For Disney = 0.3410 - 0.2109 (1.25) + 0.0000033 (62,068) + 0.0274 (.1952) + 0.1825 (.2495) - 0.0167 (.0117) = 33.29%
Substituting into the regression equation for the dividend yield, we predict the following dividend yield for Disney:
For Disney = 0.0189 - 0.0121 (1.25) + 0.00000016 (62,068) + 0.0056 (.1952) + 0.0094 (.2495) - 0.0028 (.0117) = 1.71%
Both measures suggest that Disney is not paying enough in dividends, with a dividend payout ratio of 19.73% and a dividend yield of 0.67%, given its growth, risk and capital investment characteristics.
Project Suggestion: Again, given the difficulty of running a market-wide regression, you can skip this part.
Conclusions on Dividend Policy
In summary, Disney has earned itself some flexibility on dividend policy as a result of its strong stock price performance and returns on its projects. The perception on the part of stockholders that incumbent management is not responsive to their needs, and Disney’s recent acquisition of Capital Cities (which at $ 18.5 billion dwarfs all other investments that Disney has made), suggest that Disney will operate on a short leash. A year or two of disappointing earnings and stock price performance could very well make a restive group of stockholders into a rebellious group, demanding more stock buybacks and dividends.
X. Valuation
Choosing the Right Model
We valued Disney, using a
Estimation Inputs
The inputs are summarized on the next page.
Project Suggestion: You are now looking at the future. There are no right answers, but there are some answers that are more reasonable than others. Make your best estimates of the inputs, and make sure that they are consistent. Use the most current data you can for each input.
Valuation
We valued Disney as follows:
The present values of the free cash flows to the firm and the present value of the terminal value are computed, and the sum is reported below:
Value of Disney = $ 57,817 million
If we subtract out the market value of existing debt of $ 11,180 million from this firm value, we arrive at the value of equity for Disney to be $ 46,637 million. The value of equity per share is computed by dividing by the number of shares outstanding:
Value of Equity per Share = $46,637/ 675.13 = $ 69.08
Thus, the valuation suggests that Disney was overvalued at $ 75.13 per share.
Project Suggestion: The debt you should be subtracting out at this stage of the process should be exactly the same debt that you used in computing your current cost of capital.
Summary of Assumptions for Valuation
|
|
|
|
|
| Length of Period |
|
|
Forever after 10 years |
| Revenues | Current Revenues: $ 18,739; Expected to grow at same rate a operating earnings | Continues to grow at same rate as operating earnings | Grows at stable growth rate |
| Pre-tax Operating Margin | 29.67% of revenues, based upon 1996 EBIT of $ 5,559 million. | Increases gradually to 32% of revenues, due to economies of scale. | Stable margin is assumed to be 32%. |
| Tax Rate | 36% | 36% | 36% |
| Return on Capital | 20% (approximately 1996 level) | Declines linearly to 16% | Stable ROC of 16% |
| Working Capital | 5% of Revenues | 5% of Revenues | 5% of Revenues |
| Reinvestment Rate
(Net Cap Ex + Working Capital Investments/EBIT) |
50% of after-tax operating income; Depreciation in 1996 is $ 1,134 million, and is assumed to grow at same rate as earnings | Declines to 31.25% as ROC and growth rates drop:
Reinvestment Rate = g/ROC |
31.25% of after-tax operating income; this is estimated from the growth rate of 5%
Reinvestment rate = g/ROC |
| Expected Growth Rate in EBIT | ROC * Reinvestment Rate = 20% * .5 = 10% | Linear decline to Stable Growth Rate | 5%, based upon overall nominal economic growth |
| Debt/Capital Ratio | 18% | Increases linearly to 30% | Stable debt ratio of 30% |
| Risk Parameters | Beta = 1.25, ke = 13.88%
Cost of Debt = 7.5% (Long Term Bond Rate = 7%) |
Beta decreases linearly to 1.00; Cost of debt stays at 7.5% | Stable beta is 1.00.
Cost of debt stays at 7.5% |
The Valuation of Disney
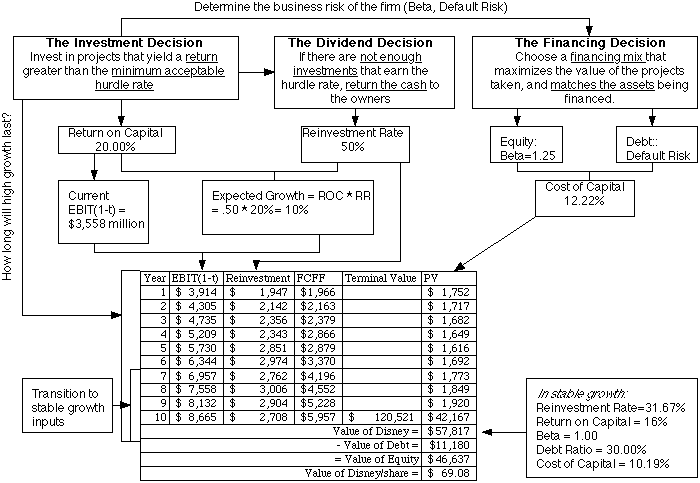
Exhibit 1: Directors at Disney and Relationship to Mr. Eisner

Exhbit 2: CEO Pay Package