A Relative Valuation: PE ratios for food companies in October 2013
Data Source: Capital IQ
Screened companies: All publicly traded companies listed anywhere in the globe in the food products business (as categorized by CIA) on October 29, 2013, with positive net income and estimates of long term expected growth rates for the next 5 years. There are 223 companies that made it through these screens.
Potential biases: Screening for positive net income biases us towards healthier food products firms and screening for long term expected growth biases us towards larger, market cap firms that are tracked by analysts. To see the extent of the bias, take a look at how the sample size shrinks as these screens are imposed:
|
Number of companies |
1563 |
|
Number with positive earnings |
1027 |
|
Number with positive earnings & long term
earnings growth rate |
223 |
Data: The raw data for the firms from CIQ is available in this data set.
Visualizing the data: The PE ratio for each firm is computed by dividing the market capitalization by the net income. The distribution of PE ratios across the firms in the sample is shown below:
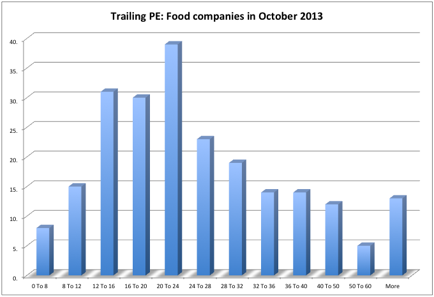
No surprises here. The distribution is skewed, with a tail to the right and a peak to the left. You can see the multiples and key fundamentals for each of the companies in the sample in this data set.
Descriptive statistics: Looking at the standard descriptive statistics, we obtain the following:
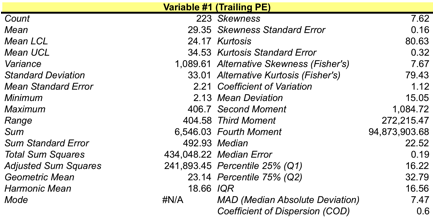
Note that the median (22.52) is lower than the average and that the 25th percentile is at 16.22 & the 75th percentile at 32.79.
The lowest PE stocks: Looking at the distribution, it clear that a PE ratio of 16 or below would be cheap in this sector, but the ten companies with the lowest PE ratios are listed below:
Company Name |
Exchange:Ticker |
Geographic Region |
Trailing PE |
Expected growth rate |
Emerging Market Dummy |
| Usher Agro Limited (BSE:532765) | BSE:532765 |
Asia / Pacific |
2.13 |
14.00% |
1 |
| Gujarat Ambuja Exports Limited (BSE:524226) | BSE:524226 |
Asia / Pacific |
2.94 |
41.00% |
1 |
| Dean Foods Company (NYSE:DF) | NYSE:DF |
United States and Canada |
3.70 |
13.60% |
0 |
| Chordia Food Products Limited (BSE:519475) | BSE:519475 |
Asia / Pacific |
3.84 |
11.00% |
1 |
| China Minzhong Food Corporation Limited (SGX:K2N) | SGX:K2N |
Asia / Pacific |
4.76 |
20.00% |
1 |
| Sino Grandness Food Industry Group Limited (SGX:T4B) | SGX:T4B |
Asia / Pacific |
6.43 |
24.00% |
1 |
| Avanti Feeds Ltd. (BSE:512573) | BSE:512573 |
Asia / Pacific |
6.49 |
27.00% |
1 |
| MHP S.A. (LSE:MHPC) | LSE:MHPC |
Europe |
7.76 |
15.80% |
0 |
| Kernel Holding S.A. (WSE:KER) | WSE:KER |
Europe |
8.27 |
4.00% |
0 |
| Honeywell Flour Mills Plc (NGSE:HONYFLOUR) | NGSE:HONYFLOUR |
Africa / Middle East |
8.29 |
16.00% |
1 |
| La Doria SpA (BIT:LD) | BIT:LD |
Europe |
8.47 |
23.20% |
0 |
| Premier Foods plc (LSE:PFD) | LSE:PFD |
Europe |
9.09 |
1.60% |
0 |
Of the ten companies, seven are in emerging markets and the only US company on the list (Dean Foods) is burdened with a very high debt to equity ratio. Thus, these may be among the riskier companies in the group. Of the remaining two European companies, one (Kernel Holding) has low expected growth, leaving only one company on the list (MHP) as potentially worth exploring.
The determinants of PE
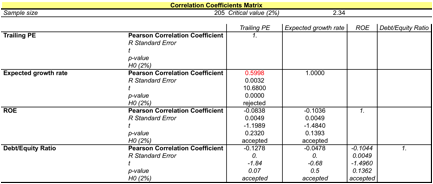
There are three key determinants of PE ratios: expected growth, cost of equity and payout. I will use the analyst estimate of long term growth as my proxy for growth, the debt to equity ratio as the proxy for risk (higher D/E -> more risk) and higher return on equity (to capture the quality of growth). The correlation between trailing PE and these variables is captured in the correlation matrix below:
The variable that seems to be most highly correlated with PE in this sample is expected growth and the correlation with risk and quality of growth is weak.
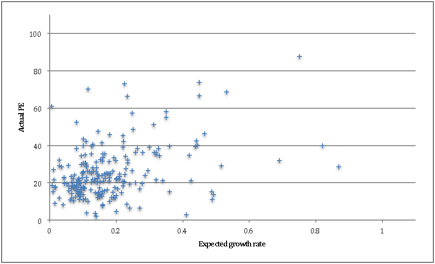
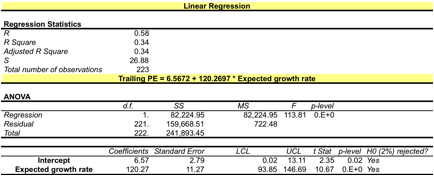
PE versus Growth Regression
The first step in understanding the relationship between PE and growth is to run a scatter plot across the food product companies:
A simple, linear regression of PE against expected growth yields the following:
Looking at the data, there does seem to be a pattern with emerging market companies having lower PE ratios than developed market companies. To capture that effect, I created a dummy variable, setting it to zero for companies from the US and Europe (considered developed markets) and 1 for companies from Asia, Latin America and Africa (emerging market). The resulting regression is below:
The dummy variable for emerging markets has a negative coefficient, albeit with a marginally significant t statistic, and can be read as follows. Holding all else constant, the PE ratio for an emerging market food company is 4.57 lower than the PE ratio for a developed market.
Predicted values
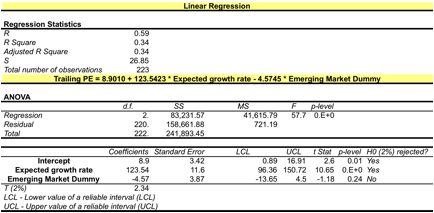
We can use this regression to get predicted PE ratios for individual companies. Take, for instance, the predicted PE ratio for Nestle, a developed market company with an expected growth rate of 6.59% would be:
Predicted PE Nestle= 8.9010 + 123.5423 (.0659) – 4.4745 (0) = 17.04
At its current PE of 20.50, Nestle is slightly over valued. The attached data set contains the predicted PE ratios for all of the firms in the sample.
In the table below, I list the fifteen companies that are cheapest on the basis of the ratio of actual PE to predicted PE:
|
Company
Name |
Geographic
Region |
Actual
PE |
Predicted
PE |
%
Under or Over value |
|
Gujarat
Ambuja Exports Limited (BSE:524226) |
Asia /
Pacific |
2.94 |
54.98 |
-94.66% |
|
Usher
Agro Limited (BSE:532765) |
Asia /
Pacific |
2.13 |
21.62 |
-90.17% |
|
Dean
Foods Company (NYSE:DF) |
United
States and Canada |
3.70 |
25.70 |
-85.59% |
|
China
Minzhong Food Corporation Limited (SGX:K2N) |
Asia /
Pacific |
4.76 |
29.03 |
-83.60% |
|
Kaveri Seed Company
Limited (BSE:532899) |
Asia /
Pacific |
11.10 |
64.74 |
-82.85% |
|
Avanti
Feeds Ltd. (BSE:512573) |
Asia /
Pacific |
6.49 |
37.68 |
-82.77% |
|
Sino
Grandness Food Industry Group Limited (SGX:T4B) |
Asia /
Pacific |
6.43 |
33.98 |
-81.06% |
|
Natra, S.A. (CATS:NAT) |
Europe |
13.72 |
69.68 |
-80.32% |
|
Chordia Food Products
Limited (BSE:519475) |
Asia /
Pacific |
3.84 |
17.92 |
-78.57% |
|
Atria
Oyj (HLSE:ATRAV) |
Europe |
15.12 |
69.07 |
-78.10% |
|
La
Doria SpA (BIT:LD) |
Europe |
8.47 |
37.56 |
-77.46% |
|
Marine
Harvest ASA (OB:MHG) |
Europe |
28.48 |
116.26 |
-75.50% |
|
MHP
S.A. (LSE:MHPC) |
Europe |
7.76 |
28.42 |
-72.70% |
|
Tata
Coffee Ltd. (BSE:532301) |
Asia /
Pacific |
15.19 |
48.80 |
-68.86% |
|
Honeywell
Flour Mills Plc (NGSE:HONYFLOUR) |
Africa /
Middle East |
8.29 |
24.09 |
-65.59% |
What next?
I view screening as a mechanism for getting a sub sample of companies
that I can turn my full attention to, rather than a buy list. In my case, as a
believer in intrinsic valuation, I would try to value each of these companies
using a discounted cash flow model and scan news stories for recent news that
may explain the low pricing (an accounting scandal, a catastrophic loss etc.).