Group
Conclusions: Apple iTV
All of the numbers below were extracted from your emails to me… So, I bear no responsibility for strange looking numbers or outliers…. That said, here is the bottom line.
On return on capital, the distribution of values was as follows:
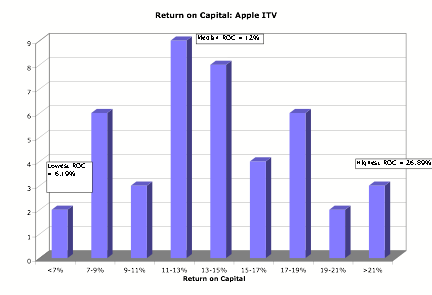
The median return on capital was about 12%, with a substantial range on the estimates.
On cost of capital, the numbers looked as follows:
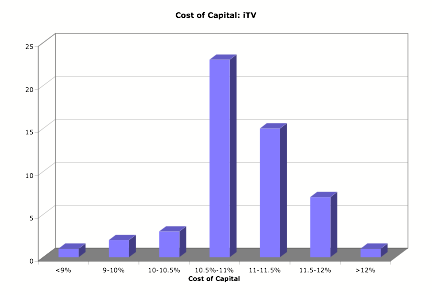
Not surprisingly, a much tighter estimate on values. My guess is that the outliers here can be explained by the use of the company’s beta (for the really high numbers) or book value of equity in computing cost of capital (for the lower numbers). The median cost of capital was about 11%.
On the NPV for the finite life case, the distribution of values was as follows:
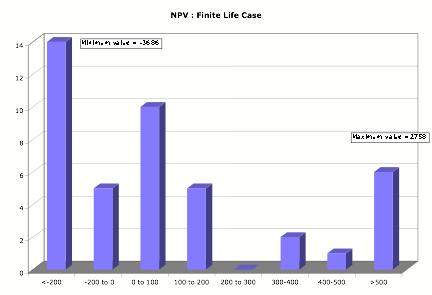
The median NPV was positive but a large proportion (about 40%) had negative net present values.
Things did look brighter when you considered the longer life scenario:
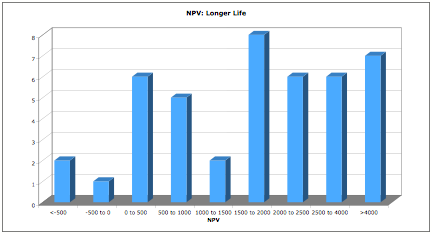
Only a handful of analyses had negative net present values and the median was almost $ 2 billion.
Based upon all this number crunching, your decision on whether to invest or not to invest could be categorized as follows:
NPV results %
of groups Decision
+’ve for both finite and longer life 52% Invest: 100%
Do not: 0%
+’ve for longer life, -ve for finite 38% Invest: 40%
Do not invest: 40%
Invest and don’t: 20%
-ve for both scenarios 10% Do not invest: 100%
No matter what you concluded, thank
you for putting in the effort that you obviously did… I truly appreciate it.