PEG Ratios
Investment Strategies that compare PE to the expected growth rate
- If we assume that all firms within a sector have similar growth rates and risk, a strategy of picking the lowest PE ratio stock in each sector will yield undervalued stocks.
- Portfolio managers and analysts sometimes compare PE ratios to the expected growth rate to identify under and overvalued stocks.
- In the simplest form of this approach, firms with PE ratios less than their expected growth rate are viewed as undervalued.
- In its more general form, the ratio of PE ratio to growth is used as a measure of relative value.
Problems with comparing PE ratios to expected growth
- In its simple form, there is no basis for believing that a firm is undervalued just because it has a PE ratio less than expected growth.
- This relationship may be consistent with a fairly valued or even an overvalued firm, if interest rates are high, or if a firm is high risk.
- As interest rate decrease (increase), fewer (more) stocks will emerge as undervalued using this approach.
PE Ratio versus Growth - The Effect of Interest rates:
Average Risk firm with 25% growth for 5 years; 8% thereafter

PE Ratios Less Than The Expected Growth Rate
- In September 1997,
- 22.7% of firms had PE ratios lower than the expected 5-year growth rate
- 77.3% of firms had PE ratios higher than the expected 5-year growth rate
- In comparison,
- 25.6% of firms had PE ratios lower than the expected 5-year growth rate in September 1996
- 38.1% of firms had PE ratios less than the expected 5-year growth rate in September 1991
- 65.3% of firm had PE ratios less than the expected 5-year growth rate in 1981.
PEG Ratio: Definition
- The PEG ratio is the ratio of market price to expected growth in earnings per share.
PEG = PE / Expected Growth Rate in Earnings
- Definitional tests:
- Is the growth rate used to compute the PEG ratio
- on the same base? (base year EPS)
- over the same period?(2 years, 5 years)
- from the same source? (analyst projections, consensus estimates..)
- Is the earnings used to compute the PE ratio consistent with the growth rate estimate?
- No double counting: If the estimate of growth in earnings per share is from the current year, it would be a mistake to use forward EPS in computing PE
- If looking at foreign stocks or ADRs, is the earnings used for the PE ratio consistent with the growth rate estimate? (US analysts use the ADR EPS)
PE/Expected Growth Rates Across the Market

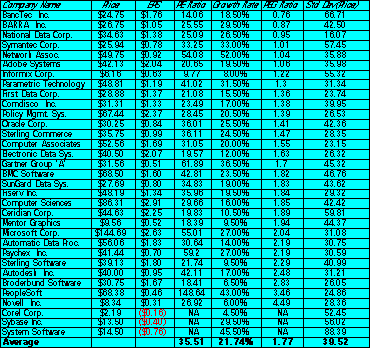
PEG Ratios: A Quick Test

PEG Ratio: Reading the Numbers
The average PEG ratio for the software sector is 1.77. The lowest PEG ratio in the group belongs to BancTec, which has a PEG ratio of 0.76. Using this measure of value, BancTec is
- the most under valued stock in the group
- the most over valued stock in the group
- What other explanation could there be for BancTecís low PEG ratio?
PEG Ratio: Analysis
- To understand the fundamentals that determine PEG ratios, let us return again to a 2-stage equity discounted cash flow model

- Dividing both sides of the equation by the earnings gives us the equation for the PE ratio. Dividing it again by the expected growth ëgí

PEG Ratios and Fundamentals
- Risk and payout, which affect PE ratios, continue to affect PEG ratios as well.
- Implication: When comparing PEG ratios across companies, we are making implicit or explicit assumptions about these variables.
- Dividing PE by expected growth does not neutralize the effects of expected growth, since the relationship between growth and value is not linear and fairly complex (even in a 2-stage model)
A Simple Example
- Assume that you have been asked to estimate the PEG ratio for a firm which has the following characteristics:
Variable High Growth Phase Stable Growth Phase
Expected Growth Rate 25% 8%
Payout Ratio 20% 50%
Beta 1.00 1.00
- Riskfree rate = T.Bond Rate = 6%
- Required rate of return = 6% + 1(5.5%)= 11.5%
- The PEG ratio for this firm can be estimated as follows:
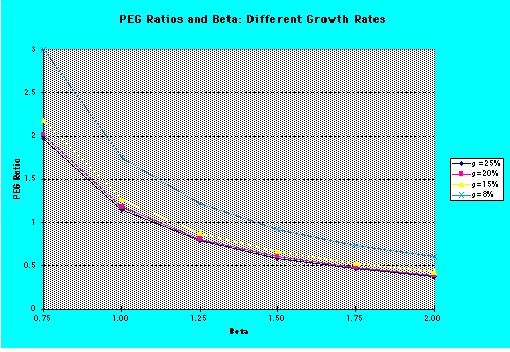
PEG Ratios and Risk

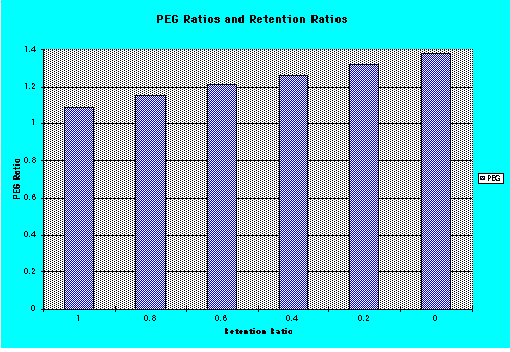
PEG Ratios and Quality of Growth

PEG Ratios and Expected Growth

PEG Ratios and Fundamentals: Propositions
Proposition 1: High risk companies will trade at much lower PEG ratios than low risk companies with the same expected growth rate.
- Corollary 1: The company that looks most under valued on a PEG ratio basis in a sector may be the riskiest firm in the sector
Proposition 2: Companies that can attain growth more efficiently by investing less in better return projects will have higher PEG ratios than companies that grow at the same rate less efficiently.
Corollary 2: Companies that look cheap on a PEG ratio basis may be companies with high reinvestment rates and poor project returns.
Proposition 3: Companies with very low or very high growth rates will tend to have higher PEG ratios than firms with average growth rates. This bias is worse for low growth stocks.
PE/growth: Returning to the Software Sector

Analyzing PE/Growth
Given that the PEG ratio is still determined by the expected growth rates, risk and cash flow patterns, it is necessary that we control for differences in these variables.
- Regressing PEG against expected growth rates, risk and cash flow patterns, we get:
PEG = 3.04 - 2.17 (Expected Growth) - 2.19 (Std Deviation in Prices)
- In other words,
- PEG ratios will be lower for high growth companies
- PEG ratios will be lower for high risk companies
Estimating the PEG Ratio for Adobe Systems
Applying this regression to Adobe Systems, the predicted PEG ratio for the firm can be estimated using Adobeís measures for the independent variables:
- Expected Growth Rate = 19.50%
- Standard Deviation in Stock Prices = 35.98%
- Plugging in,
Expected PEG Ratio for Adobe = 3.04 - 2.17 (.195) - 2.19(Std Dev) = 1.83
- With its actual PEG ratio of 1.06, Adobe looks significantly under valued.
Extending the Comparables
This analysis, which is restricted to firms in the software sector, can be expanded to include all firms in the firm, as long as we control for differences in risk, growth and payout.
- In a multiple regression,
PEG = a + b (Growth Rate) + c (Risk) + d (Payout Ratio)
Market Regressions: PEG Ratio

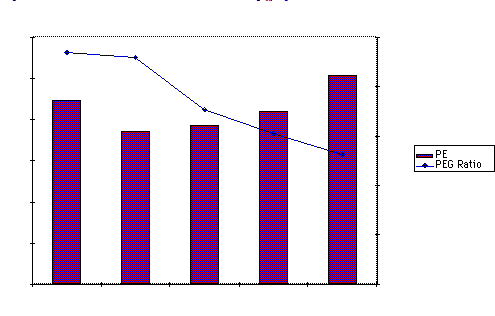
PE, PEG Ratios and Risk: September 1997


