VALUING PRIVATE COMPANIES AND DIVISIONS
PROCESS OF VALUING PRIVATE COMPANIES
- Choosing the right model
- Valuing the Firm versus Valuing Equity
- Steady State, Two-Stage or Three-Stage
- Estimating a Discount Rate
- Cost of Equity
- Cost of Debt
- Estimating Default Risk
- Estimating an after-tax cost of debt
- Cost of Capital
- Estimating Cash Flows
- Analyzing the effects of lack of liquidity
- Effects of differential voting rights
ESTIMATING COST OF EQUITY FOR A PRIVATE FIRM
- Basic Problem: Most models of risk and return (including the CAPM and
the APM) use past prices of an asset to estimate its risk parameters (beta(s)).
Private firms and divisions of firms are not traded, and thus do not have
past prices.
- Solution 1: Estimate the beta, based upon comparable firms, and
after adjusting for risk.
- Step 1: Collect a group of publicly traded comparable firms, preferably
in the same line of business, but more generally, affected by the same
economic forces that affect the firm being valued.
- A Simple Test: To see if the group of comparable firms is truly comparable,
estimate a correlation between the revenues or operating income of the
comparable firms and the firm being valued. If it is high (and positive),
of course, your have comparable firms.
- Step 2: Estimate the average beta for the publicly traded comparable
firms.
- Step 3: Estimate the average market value debt-equity ratio of these
comparable firms, and calculate the unlevered beta for the business.
- bunlevered = blevered
/ (1 + (1 - tax rate) (Debt/Equity))
- Step 4: Estimate a debt-equity ratio for the private firm. The basic
problem, however, is that you have only book values for the private firms.
This can be corrected in one of two ways ñ
- Assume that the private firm will move to the industry average debt
ratio. The beta for the private firm will then also converge on the industry
average beta. This might not happen immediately but over the long term.
Betaprivate firm =
Betaunlevered (1 + (1 - tax rate)
(Industry Average Debt/Equity))
- Estimate the optimal debt ratio for the private firm, based upon its
operating income and cost of capital. Use this optimal debt ratio to calculate
the beta. (Be consistent about then using the same debt ratio in your cash
flow estimates)
Betaprivate firm =
Betaunlevered (1 + (1 - tax rate)
(Optimal Debt/Equity))
- Step 5: Estimate a cost of equity for the private firm, based upon
this beta.
- Solution 2: Estimate an accounting beta
- Step 1: Collect accounting earnings for the private company for as
long as there is a history.
- Step 2: Collect accounting earnings for the S&P 500 for the same
time period.
- Step 3: Regress changes in earnings for the private company against
changes in the S&P 500.
- Step 4: The slope of the regression is the accounting beta
There are two serious limitations - (a) The number of observations in
the regression is small (b) Accountants smooth earnings.
ESTIMATING BETAS FOR PRIVATE FIRMS
|
New World Coffee |
New York Yankees |
Wordperfect Corporation |
| Comparable Firms |
Beta D/E
Starbucks: 1.74 9.53%
Au Bon Pain: 1.21 31.43%
Sbarro: 1.12 0.00%
Average 1.36 13.65% |
Beta D/E
Topps 0.85 0.00% |
Beta D/E
Adobe Systems 1.70 0.00%
Borland Intl 1.35 6.00%
Lotus 1.55 2.50%
Microsoft 1.35 0.00%
Average 1.49 2.12% |
| Unlevered Beta for Comparable Firms |
1.25 |
0.85 |
1.47 |
| Debt/Equity Ratio for this firm |
13.65%
(Assumed move to industry average) |
30.00%
(Based upon management target) |
10.00%
(Target Debt Ratio) |
| Estimated Beta for this firm |
1.36 |
1.00 |
1.56 |
| Estimated Cost of Equity |
14.98% |
13.00% |
16.08% |
ESTIMATING THE COST OF DEBT FOR A PRIVATE FIRM
- Basic Problem: Private firms generally do not access public debt markets,
and are therefore not rated. Most debt on the books is bank debt, and the
interest expense on this debt might not reflect the rate at which they
can borrow (especially if the bank debt is old.)
- Solution 1: Assume that the private firm can borrow at the same rate
as similar firms (in terms of size) in the industry.
Cost of Debt for Private firm = Cost of Debt for similar
firms in the industry
- Solution 2: Estimate an appropriate bond rating for the company, based
upon financial ratios, and use the interest rate estimated bond rating.
Cost of Debt for Private firm = Interest Rate based upon
estimated bond rating for private firm
Note: If the beta is calculated based upon the assumption that the firm
will move to its optimal debt ratio, use the corresponding bond rating.
- Solution 3: If the debt on the books of the company is long term and
recent, the cost of debt can be calculated using the interest expense and
the debt outstanding.
Cost of Debt for Private firm = Interest Expense / Outstanding
Debt
Note: If the firm borrowed the money towards the end of the financial
year, the interest expenses for the year will not reflect the interest rate
on the debt.
ESTIMATING THE COST OF DEBT
|
New World Coffee |
New York Yankees |
Wordperfect Corporation |
| Comparable Firms |
kd D/E
Starbucks: 9.00% 9.53%
Au Bon Pain: 8.50% 31.43%
Sbarro: NA 0.00% |
kd D/E
Topps NA 0.00% |
kd D/E
Adobe Systems NA 0.00%
Borland Intl 9.00% 6.00%
Lotus 8.25% 2.50%
Microsoft NA 0.00% |
| Median Cost of Debt |
8.75% |
NA |
8.60% |
| Interest Coverage Ratio for this firm |
Not used |
2.95 |
Not used |
| Rating based upon this coverage ratio |
Not used |
BBB |
Not used |
| Interest Rate paid on Recent Borrowing |
Not used |
Not used |
8.80% |
| Estimated Cost of Debt |
8.75%
(Assumed to borrow at industry rate) |
9.50%
(Based upon bond rating) |
8.80% |
ESTIMATING THE COST OF CAPITAL
Basic problem: The debt ratios for private firms are
stated in book value terms, rather than market value. Furthermore, the
debt ratio for a private firm that plans to go public might change as a
consequence of that action.
Solution 1: Assume that the private firm will move
towards the industry average debt ratio.
Debt Ratio for Private firm = Industry Average Debt Ratio
- Solution 2: Assume that the private firm will move towards its optimal
debt ratio.
Debt Ratio for Private firm = Optimal Debt Ratio
Consistency in assumptions: The debt ratio assumptions used to
calculate the beta, the debt rating and the cost of capital weights should
be consistent. In other words, if the assumption is that the firm will move
to the industry average debt ratio, the beta should be calculated using
the industry average debt/equity ratio, the bond rating should be estimated
by looking at similar firms in the industry, and the cost of capital should
be calculated using the same debt ratio.
ESTIMATING COSTS OF CAPITAL FOR PRIVATE FIRMS
|
New World Coffee |
New York Yankees |
Wordperfect Corporation |
| Cost of Equity |
14.98% |
13.00% |
16.08% |
| E/ (D+E) |
87.99% |
76.92% |
90.91% |
| Cost of Debt |
8.75% |
9.50% |
8.80% |
| AT Cost of Debt |
5.25% |
5.70% |
5.28% |
| D/(D+E) |
12.01% |
23.08% |
9.09% |
| Cost of Capital |
13.81% |
11.32% |
15.10% |
ESTIMATING CASH FLOWS FOR A PRIVATE FIRM
- Special Problems associated with estimating cash flows for a private
firm
- Shorter history: Private firms often have been around for much shorter
time periods than most publicly traded firms. There is therefore less historical
information available on them.
- Different Accounting Standards: The accounting statements for private
firms are often based upon different accounting standards than public firms,
which operate under much tighter constraints on what to report and when
to report.
- Intermingling of personal and business expenses: In the case of private
firms, some personal expenses may be reported as business expenses.
- Separating ìSalariesî from ìDividendsî: It
is difficult to tell where salaries end and dividends begin in a private
firm, since they both end up with the owner.
- Dealing with Special Problems
- Restate earnings, if necessary, using consistent accounting standards.
- If any of the expenses are personal, estimate the income without these
expenses.
- Estimate a ìreasonableî salary based upon the services
the owner provides the firm.
ESTIMATING VALUE OF PRIVATE FIRMS
|
New World Coffee |
New York Yankees |
Wordperfect Corporation |
| EBIT |
$ 10.50 million |
$27.50 million |
$ 125 million |
| EBIT Restated |
$ 9.50 million
(Owners did not charge themselves salaries in the firm.
The combined salaries are assumed to be $1 mil) |
$32.50 million
(Both salaries and operating expenses were high relative
to other teams. The ìexcessí expenditure of $ 5 million is
stripped from EBIT) |
$ 125 million |
| EBIT Restated (1-t) |
$ 5.70 million |
$ 19.50 million |
$ 75 million |
| (CEx-Depr) |
$ 3 million |
$ 0.00 million |
$ 15 million |
| Working Capital as % of Revenues |
10 % of Revenues:
$ 2 million |
No Working Capital |
30% of Revenues:
$ 12 million |
Growth Rates
High Growth
Stable Growth |
40% for 5 yrs; Transition is 5 yrs;
5% a year |
No high growth
5 % a year |
15% a year for 10 years
5% a year |
| Cost of Capital |
13.81% |
11.32% |
15.10% |
Firm Value
- Outstanding Debt
= Equity Value
$ 254.32 million
- $ 30.55 million
= $ 223.77 million |
$ 324.00 million
- $ 75.00 million
= 249.00 million |
$ 1269 million
- 115 million
= $ 1154 million |
ANALYZING THE EFFECT OF ILLIQUIDITY ON VALUE
Investments which are less liquid should trade for less
than otherwise similar investments which are more liquid.
- Determinants of the Liquidity Discount
- Type of Assets owned by the Firm: The more liquid the assets
owned by the firm, the lower should be the liquidity discount for securities
issued by the firm.
- Size of the Firm: The larger the firm, the smaller should be
size of the liquidity discount.
- Health of the Firm: Stock in healthier firms should sell for
a smaller discount than stock in troubled firms.
- Cash Flow Generating Capacity: Securities in firms which are
generating large amounts of cash from operations should sell for a smaller
discounts than securities in firms which do not generate large cash flows.
- Size of the Block: The liquidity discount should increase with
the size of the block.
- Empirical Evidence
Restricted Stock: Restricted securities are securities issued
by a company, but not registered with the SEC, that can be sold through
private placements to investors, but cannot be resold in the open market,
except under provisions of SECís rule 144. Restricted securities
are defined in SEC 144 as ìsecurities that are acquired directly
or indirectly from the issuer... that are subject to resale limitationsî.
SEC 144 goes on to add that ìa minimum of two years must elapse between
the later of the date of the acquisition of the securities from the issuer..
and any resale of such securitiesî. They cannot be sold for a two-year
holding period, and limited amounts can be sold after that.
- In studies of these securities going back to 1966, there have been
several consistent findings ñ
- Restricted securities trade at significant discounts on publicly traded
shares in the same company.
- Maher examined restricted stock purchases made by four mutual funds
in the period 1969-73 and concluded that they traded an average discount
of 35.43% on publicly traded stock in the same companies.
- Moroney reported a mean discount of 35% for acquisitions of 146 restricted
stock issues by 10 investment companies, using data from 1970.
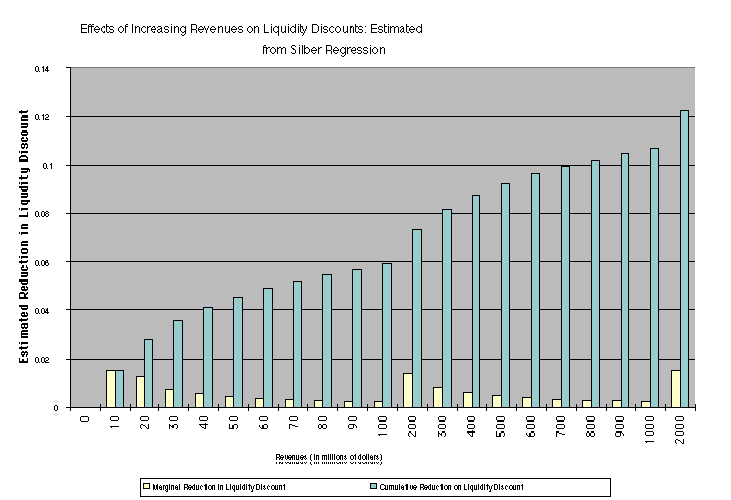
- In a recent study of this phenomenon, Silber finds that the median
discount for restricted stock is 33.75%.
- Silber reports that the discounts tend to be smaller for larger and
more diversified companies, and larger for companies in trouble. Silber
(1991) develops the following relationship between the size of the discount
and the characteristics of the firm issuing the registered stock ñ
LN(RPRS) = 4.33 +0.036 LN(REV) - 0.142 LN(RBRT) + 0.174
DERN + 0.332 DCUST
where,
RPRS = Relative price of restricted stock (to publicly traded stock)
REV = Revenues of the private firm (in millions of dollars)
RBRT = Restricted Block relative to Total Common Stock in %
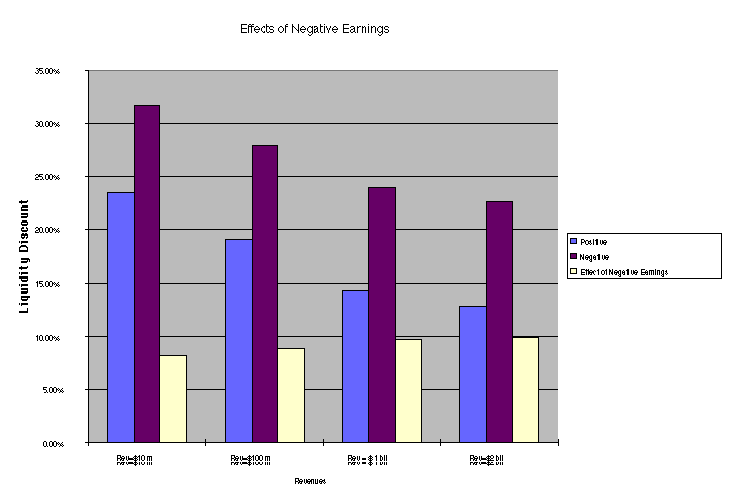
DERN = 1 if earnings are positive; 0 if earnings are negative;
DCUST = 1 if there is a customer relationship with the investor; 0 otherwise;
- Interestingly, Silber finds no effect of introducing a control dummy
- set equal to one if there is board representation for the investor and
zero otherwise.
From Concept to Practice
- Approach 1: Use the average liquidity discount, based upon past
studies, of 20% for private firms. Adjust subjectively for size - make
the discount smaller for larger firms.
- Approach 2: Using registered shares, estimate the discount as
a function of the determinants - the size of the firm, the stability of
cash flows, the type of assets and cash flow generating capacity. (Do a
regression, like Silber) Plug in the values for your company into the regression
to estimate the liquidity discount.
Application: Estimating the Liquidity Discount on the
New York Yankees
REV : Revenues in 1993 (last full year of baseball) = $
120 million
Liquidity Discount for small firm - with negligible revenues
= 30%
Liquidity Discount for the New York Yankees = 30% - 6% =
24%
[The 6% comes from the graph above, as the reduction in
liquidity discount as a function of the revenues]
Estimated value for the Yankees in a private transaction
= $324 million ( 1 - 0.24) = $246.24 million
ANALYZING THE VALUE OF CONTROL
If one class of shares have no voting rights while the other
class of shares do, the difference in voting rights, other things being
equal, might make the latter more valuable.
A General Framework for estimating the value of control
- The value of the control premium that will be paid to acquire a block
of equity will depend upon two factors -
1. Probability that control of firm will change: This refers to
the probability that incumbent management will be replaced. this can be
either through acquisition or through existing stockholders exercising their
muscle.
- In the more general case, this probability of control changing will
depend upon the following factors ñ
- Legal Restrictions on Takeovers: Other things remaining equal,
the greater the legal restrictions on takeovers the smaller the probability
of control changing.
- Anti-takeover and Pro-incumbent restrictions in corporate charter:
The greater the restrictions on takeovers and on changes in incumbent management
(staggered elections, restrictions on proxies...), the lower the probability
of control changing.
- Market Attitudes towards Control Changes: The probability of
control changing will be much greater is markets accept and welcome challenges
to incumbent managementís authority. (Are shareholders willing to
listen to those challenging incumbent managers? Are bankers willing to
finance their acquisitions? Will institutional stockholders stand and fight?)
- Size of stock holding controlled by incumbent management: The
greater the proportion of the voting stock controlled by the incumbent
management, the lower the probability of control changing.
- Diffusion of Holdings: While 51% is often viewed as the magic
number for gaining control, one might be able to exert control with less
than 51% if the holdings are widely held. Thus an investor with 35% of
the stock in a company may be able to exert control over the company, if
the remaining 65% is held widely. The greater the diffusion in holdings,
the lower will be the threshold for gaining control of the company.
- Relative numbers of voting and non-voting shares: The value
of control is distributed among all of the voting shares. The greater the
number of voting shares, relative to non-voting shares, the smaller is
the control premium per share.
2. Value of Gaining Control of the Company = Present Value (Value
of Company with change in control - Value of company without change in control)
+ Side Benefits of Control.
- The value of gaining control of a company arises from two sources -
the increase in value that can be wrought by changes in the way the company
is managed and run, and the side benefits and perquisites of being in control.
In the most gener