TAQ Exercise (last updated
Sunday, March 1, 2015 1:29 PM)
-
Part I (due Thursday, Feb 26)
-
Part II (due date Tuesday, March 24)
Overview
The Trade and Quote (TAQ) database contains all trades and all quote (bid/ask) updates for US equities. We'll be analyzing it offline, but it comprises the datastreams that market participants would be evaluating in real time. In this multi-part exercise you'll learn how to analyze market data.
You'll have an Excel spreadsheet with data for several stocks for one day, Thursday, December 4, 2014. You will be assigned one stock at random. I'll shortly email the stock assignments. Your work product will be a report that answers the questions, below.
You may work by yourself on this project, but if you'd prefer to work in a group, send me an email with the members of your group (no more than three people), and I'll make sure that you all have the same stock. The group can turn in one report, with the names of all participants in the group.
Part I. Trades and Quotes. Due Thursday, Feb 26, in class.
The spreadsheet TAQ04Dec2014.xlsx has two worksheets: Consolidated Trades ("CT") and Consolidated Quotes ("CQ", that is, bids and offers). Stocks are identified by ticker symbol, and are time-stamped to the millisecond. These data are documented in the NYSE's documentation (the Daily TAQ Client Specification, July 28, 2014). To keep things manageable, I've only given you a subset of the variables. (The spreadsheet is a large file -- around 2.7MB; there are 2364 rows in the CT worksheet and 44841 rows in the CQ worksheet.)
Background questions
- What is the company's full name? What does it do or make? Where is it listed (that is, what is its primary listing exchange)?
- What was the prior day's closing price (that is, the closing price on Dec 3, 2014)? (You can get this from Google Finance, among many other places.) What is the change from the previous day's close to the first trade on Dec 4?
CT analysis
A CT record describes one executed trade. For example, a portion of the trades for ticker symbol ACW on March 4, 2014 looks something like this:
| symbol |
DATE |
TIME_M |
EX |
TR_SCOND |
SIZE |
PRICE |
| ACW |
20140304 |
9:30:45.155 |
P |
Q |
137 |
$4.6000 |
| ACW |
20140304 |
9:30:45.155 |
P |
@ |
137 |
$4.6000 |
| ACW |
20140304 |
9:30:45.155 |
P |
@ |
263 |
$4.6000 |
| ACW |
20140304 |
9:30:45.155 |
P |
@ |
200 |
$4.6000 |
| ACW |
20140304 |
9:30:45.156 |
N |
O |
8201 |
$4.6200 |
Note that the TIME_M field has been formatted as "h:mm:ss.000" (hours, minutes, seconds, milliseconds) and the PRICE field has been formatted as "currency" with four decimal places (to handle transactions that are priced in fractions of a second). For your stock:
- What is the largest single trade of the day? When was it executed? at what price?
Suggestion: use the Excel's max function on the size column.
- How much volume (in shares) was done on each exchange?
Suggestion: use Excel's pivot table function to get a breakdown of SIZE by EX.
- Between 9:00 and 17:30, plot the trades. Your graph should have linear time on the horizontal axis, and price per share on the vertical. One plotted point for each trade.
- Construct 30-minute time buckets (groups, categories, 9:30-10:00, 10:00-10:30, ... , 15:30-16:00). For example, trades at 9:31, 9:32 and 9:43 would all belong to the 9:30-10:00 group/bucket/category. In each of these buckets, compute the total number of trades.
Suggestion: create a column that maps TIME_M into the above categories. Then use a pivot table to get a breakdown by time. Also see "CT Notes," below.
- What is the market share (by share volume) of each reporting exchange? (The exchange code is reported in the "EX" column.)
- For most trades, the basic price increment ("tick") is one cent ($0.01). But trade prices can be reported in finer increments. Set the format on the price column to display four decimal places (that is, $0.0000), and find two trades that have sub-penny increments.
Suggestion: create a column that gives the sub-penny remainder on each price. That is, if PRICE is $12.3456, the subpenny remainder is "56" (or 0.0056, either should work.)
CT Notes
- Each row of the spreadsheet represents a trade, so counting trades is equivalent to counting rows.
- The size of a trade is the volume (in shares) for the trade.
- You can form time groups using the ROUNDDOWN function to round the actual times down to the closest thirty-minute interval. See the formula in B3, below. (You can download this spreadsheet fragment as TAQtimes.xlsx.)
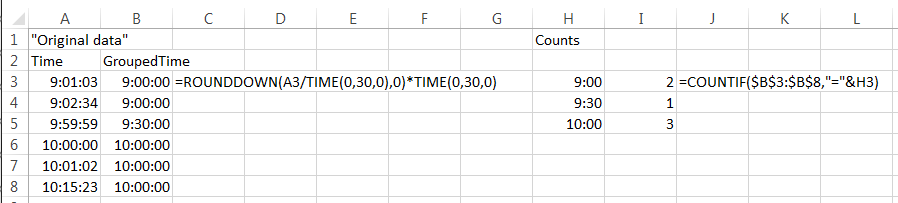
- If you don't want to do the counting using a pivot table, you can use the COUNTIF function to count times that fall into a particular interval (See the computation in I3.)
CQ analysis
A CQ record describes one quote update originating from one market center. An update occurs whenever something about that center's bid or offer has changed. It might be the bid, the offer (ask), the bidsiz (number of shares sought at the bid), or the ofrsize (number of shares available for purchase at the offer (ask). To assist you in analyzing the data, I've added four fields that are not documented in the TAQ client specification.
| Variable |
Description |
| NBB |
National best bid, the highest bid in the market. To derive this, I construct a running record of each market center's current bid, and then take the max. |
| NBO |
National best offer, the lowest offer (ask price) in the market. Here, I construct a running record of each market's current bid, and then take the min. |
| exAtBBid |
This is a string that contains the exchange codes for those exchanges that are, at that moment, at the NBB. If an exchange is alone at the bid, the string will have one exchange, but often there will be more. |
| exAtBAsk |
Exchanges at the NBO (best offer/ask). |
- In each of the 30-minute time buckets (9:30-10:00, 10:00-10:30, ... , 15:30-16:00) compute the total number of quote updates.
- The bid-ask spread is NBO minus the NBB. What is the average spread in each of the 30 minute time buckets between 9:30 and 16:00?
- Find an instance of a locked market. How long does it persist?
- Between 9:30 and 16:00, for what proportion of the quotes is the primary listing exchange at the best bid?
It does not have to be alone at the best bid. For example, if the primary listing exchange is the NYSE, the NYSE is at the best bid if exATBBid is "N", "XN", "BNZ", or any other string that contains "N".
Suggestion. Insert a new column next to the exAtBBid column. In each cell of this new column, enter an "IF" formula that will evaluate to one if "N" is present in exAtBBid, and zero otherwise. Then take the average of these values.
CQ Notes
- Each row in this worksheet is a quote update, i.e., something that indicated or refreshed an exchange's quotes.
- A price of zero indicates "missing". This can happen when one or both sides of the book are empty. If there are no buy orders in the book, the bid (for that exchange) is set to zero; if there are no sell orders, the ask/offer is set to zero.
Part II. Transaction cost analysis (TCA), Due date: Tuesday, March 24.
In this part of the exercise, you'll compute transactions costs for a few trades in your stock.
- For the first two trades after 15:45:00.00, determine the trade direction by comparing the trade price to the NBBO midpoint (BAM). For these two trades, perform a TCA. Your report should include, for each trade: the times and NBBOs prevailing at the time of the trade, and five minutes after the trade; the price improvement, effective cost, price improvement and price impact. Note: if a trade has an indeterminate sign (because the trade price is equal to the BAM), go forward until you find a trade that can be signed.
- Retrieve the Rule 605 data for your stock from Interactive Brokers for December, 2014. (Go to interactivebrokers.com, then "About IB"; "IB Regulatory Reports and Financial Information"; "Interactive Brokers Rule 605 Monthly Market Center Execution Quality Reports".) You will probably find it easiest to work with the December HTML file, because it is formatted nicely. For the size category that has the largest number of trades (and this might be a small number), determine the average realized and effective spreads, and the average price improvement. NOTE: ticker symbol AOR is not traded at IB. If your symbol is "AOR", use symbol "ASA" instead.