Fund Performance

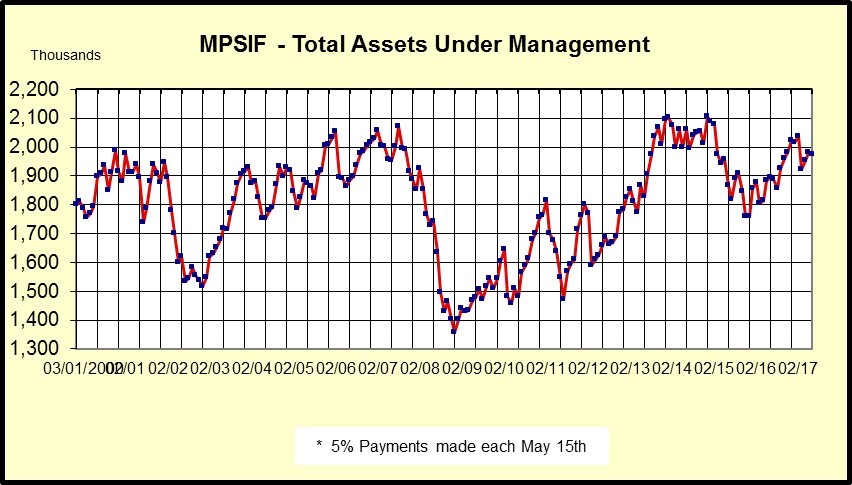
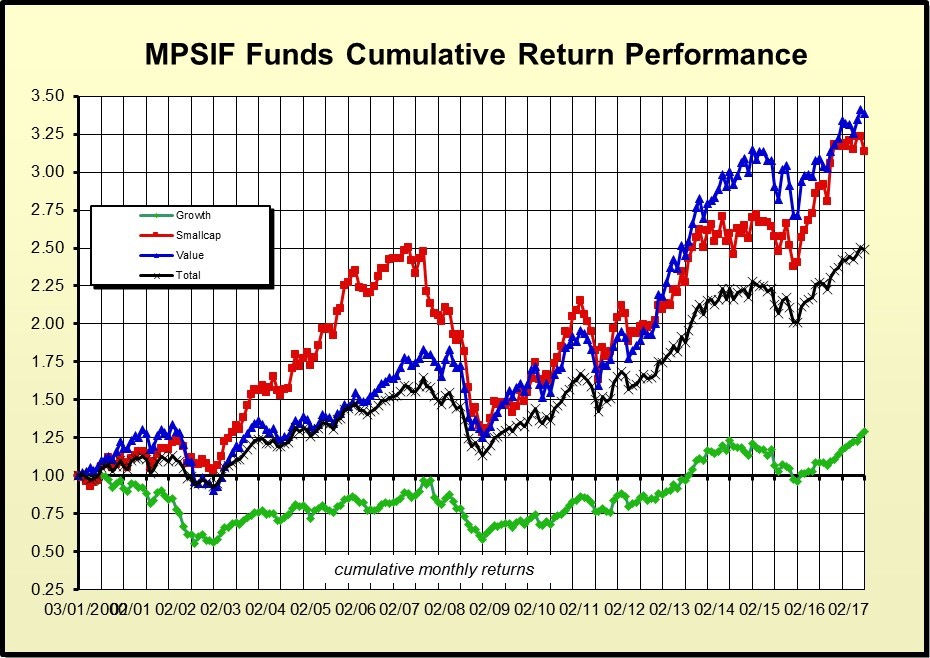
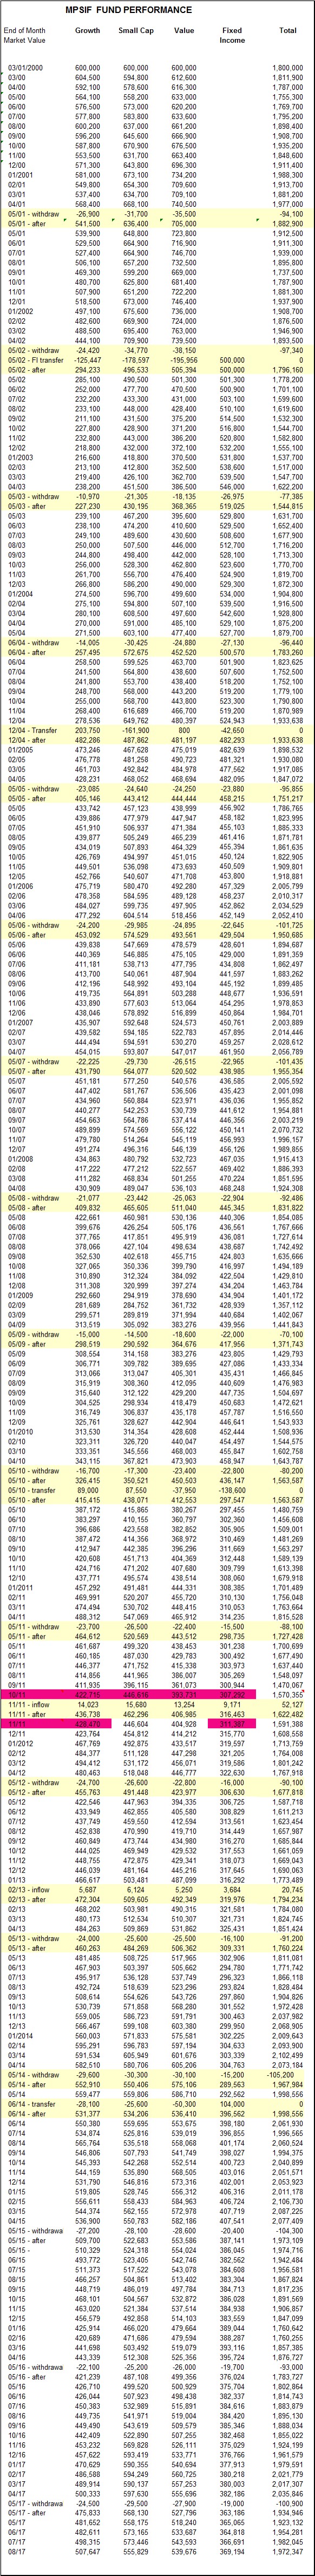
The graphs and table below show the performance of the entire
MPSIF Fund and the three equity funds on a month-by-month basis
from inception through February, 2016.
The spreadsheet containing these monthly data is available here.
back to top
back to top
back to top
More detailed information about each fund can be found using the tabs at left.