 |
|||
|
|||

I confess. I send out a lot of emails and I am sure that you don't read some of them. Since they sometimes contain important information as well as clues to my thinking (deranged though it might be), I will try to put all of the emails into this file. They are in chronological order, starting with the earliest one. They are in chronological order, starting with the earliest one. So, scroll down to your desired email and read on, or if the scrolling will take you too long, click on the link below to go the emails, by month.
| Date | Email content |
||||||||||||||||||
| 1/13/25 | Happy new year!. This is the first of many, many emails that you will get for me. You can view that either as a promise or a threat. I am delighted that you have decided to take the corporate finance class this spring with me and especially so if you are not a finance major and have never worked in finance. I am an evangelist when it comes to the centrality of corporate finance and I will try very hard to convert you to my faith. I also know that some of you may be worried about the class and the tool set that you will bring to it. I cannot alleviate all your fears now, but here are a few things that you can do to get an early jump:
1. Pre-work for class
As things stand now, and this could quickly change, we will meet in Paulson Auditorium, a cavernous amphitheater with all of the charm of Madison Square Garden on a bad day (which would be any day that the Knicks actually play there) every Monday and Wednesday, starting on January 27, going through May 5, from 10.30 am to 11.50 am. I will not take attendance, but I would really, really, really like to see you in class. If you do miss a class, the sessions will be recorded and will be available in three places:
You can find out all you need to know about the class (for the moment) by going to the web page for the class:
http://www.stern.nyu.edu/~adamodar/New_Home_Page/corpfin.htmlThis page has everything connected to the class, including webcast links, lecture notes and project links. The syllabus has been updated: https://pages.stern.nyu.edu/~adamodar/pdfiles/cfovhds/cfsyllspr25.pdfIf you click on the calendar link, you will be taken to a Google calendar of everything related to this class. You will note references to a project which will be consuming your lives for the next four months. This project will essentially require you to do a full corporate financial analysis of a company. While there is nothing you need to do at the moment for the project, you can start thinking about a company you would like to analyze and a group that you want to be part of.
3. Class Material
Now for the material for the class. The lecture notes for the class are available as a pdf file that you can download and print. I have both a standard version (one slide per page) and an environmentally friendly version (two slides per page) to download. You can also save paper entirely and download the file to your iPad or Kindle. The first packed can be found at the link below:
It is a big file and will take while to download. Have patience
There is a book for the class, Applied Corporate Finance, but please make sure that you get the fourth edition. It is exorbitantly over priced but you can buy, rent or download it at Amazon.com or the NYU bookstore
While I have no qualms about wasting your money, I know that some of you are budget constrained (a nice way of saying "poor") . If you really, really cannot afford the book, you should be able to live without it.
4. Final Thoughts
I know that In the last decade, we have been forced to reexamine accepted wisdom in pretty much aspect of life, and corporate finance is no exception. As we struggle with the new and the different, we have to incorporate the lessons learned, unlearned and relearned over this period into corporate finance, and I will tru. There are assumptions that we have made for decades that need to be challenged and foundations that have to be reinforced. In other words, the time for cookbook and me-too finance (which is what too many firms, investment banks and consultants have indulged in) is over. At the same time, there is a whole lot nonsense that has been bandied about as the “new way to run business” and I will not mince any words (or spare any feelings) in talking about them. To close, I will leave you with a YouTube video that introduces you (in about 2 minutes) to the class.
I hope you enjoy it. That is about it. I am looking forward to this class. It has always been my favorite class to teach (even more so than valuation, my other teaching venture) and I have a singular objective. I would like to make it the best class you have ever taken, period. I know that this is going to be tough to pull off but I will really try. I hope to see you on January 27th, in class. Until next time!
|
||||||||||||||||||
| 1/20/25 | I hope that you have had a good week since my last email, and if your response is what last email, you may want to check this link:
Next week, at the first class, I will spend time laying out what the class is about, what I hope that we will accomplish during the semester, as well as establish the key themes that underlie corporate finance. You can download the syllabus ahead of time:
As you read the syllabus, you will notice mention of a project and in case you are curious, here is the link to the project resources:
Once we are through the syllabus in the first session, we will turn our attention to the lecture note packets, and every slide you see in class after this will be in that packet. The lecture notes are in two parts, and the first part can be obtained at this link (which I sent you last week as well):
It is also available in powerpoint form (though the file size is bloated), if you go to the lecture note page or webcast page of the class. (Again, if you have trouble getting these links to download, try a different browser)
Now that I have drowned you in stuff, just a little aside. I don’t much care for academic research and almost everything that I write is for practitioners, and my blog (sounds new age, doesn’t it?) has become the first repository for my writing. I spend the first few weeks of each year, talking about the data that I update on my website:
The first two updates re on my blog. Please browse through them, because they are relevant for class:
I will see you in class next week (Monday. January 27, at 10.30 am, NY time on in Paulson Auditorium. I would obviously love to see you in person in class, but if for any reason, you are unable to make it to class, it will be carried as a live zoom session, and the zoom link for all of the sessions is below:
The sessions will also be available in recorded form. Until next time! |
||||||||||||||||||
| 1/26/25 | As we finish up the last weekend before class, I am sending this as a last pre-class email. When I start class tomorrow, it will be my 41st year teaching and I am thankful that I still look forward to the day. There is no other profession where you can start with a clean slate every few months, even though you may screw it up in the subsequent days and weeks. We will meet in Paulson from 10.30 am - 11.50 am for our first class, and it will be glorious (I have got to hype it up as much as I can). I would love to see you all in class, but I do realize that some of you will not be able to make it in class for a variety of reasons, and worry not, since the class will be carried live on Zoom. The zoom link for the class is below:
The recorded versions of the session will also be accessible at the webcast page for the class (see link below).
This page also has the links to the lecture notes and other material for the class.
During the first class, it would have been standard practice for me to hand out the syllabus and project description, but I think that if we truly live in a digital world, it is time to phase out this practice. So, please download the two packets and bring either a digital or physical copy to class tomorrow.
Project Description: https://pages.stern.nyu.edu/~adamodar/pdfiles/cfovhds/cfproj.pdf
At the risk of repeating myself, the lecture note packets for the class are also ready and you can find the links at the top of the webpage for the class sessions:
I am a believer in data, respecting (but not revering) it, and every year, I play Moneyball, with public data. (If you have not watched the movie yet, that is your assignment for tonight). If you are interested in my data updates, you may want to start by reading my first three data posts for 2025:
Until next time!
|
||||||||||||||||||
| 1/27/25 | I promised you with a ton of emails and I always deliver on my promises... Here is the first of many, many missives that you will receive for me….. First, a quick review of what we did in today's class. I laid out the structure for the class and an agenda of what I hope to accomplish during the next 15 weeks. In addition to describing the logistical details, I presented my view that corporate finance is the ultimate big picture class because everything falls under its purview. The “big picture” of corporate finance covers the three basic decisions that every business has to make: how to allocate scarce funds across competing uses (the investment decision), how to raise funds to finance these investments (the financing decision) and how much cash to take out of the business (the dividend decision). The singular objective in corporate finance is to maximize the value of the business to its owners. This big picture was then used to emphasize five themes: that corporate finance is common sense, that it is focused, that the focus shifts over the life cycle and that you cannot break first principles with immunity.
On to housekeeping details.
That is about it, for this email. |
||||||||||||||||||
| 1/28/25 | In the first puzzle for this semester, I am going to focus on the objective in corporate finance, In class, I said that the end game is to maximize the value of the business and that objective has given corporate finance its focus, but has also given rise to criticism that it comes at the expense of other claimholders. That is a legitimate point, and even the Business Roundtable seemed to come around to a stakeholder point of view in this missive:
In a post shortly thereafter, I took issue with the Business Roundtable, and argued that it was the wrong message and that the messenger, Jamie Dimon, was singularly ill equipped to talk about shareholder interests, given how cavalierly he has ignored them over his tenure.
I know that many of you will disagree with me on my conclusions, but I think that this will be a great start for tomorrow’s class. So, please read both and try to answer these questions:
Since this is the type of discussion that is enriched by everyone joining, I have created a forum on the topic under Brightspace, for this class. Log in, check under content, and then under weekly puzzles and you should see the forum. You can post your thoughts, any interesting links or dissenting points of view there. |
||||||||||||||||||
| 1/29/25 | In today's class, we started on what the objective in running a business should be. While corporate finance states it to be maximizing firm value, it is often practiced as maximizing stock price. To make the world safe for stock price maximization, we do have to make key assumptions: that managers act in the best interests of stockholders, that lenders are fully protected, that information flows to rational investors and that there are no social costs. We started on why one of these assumptions, that stockholders have power over managers, fails and we will continue ripping the Utopian world apart next class.
1. Other People's Money: Just a few added notes relating to the class that I want to bring to your attention. The first is the movie Other People's Money, which is one of my favorites for illustrating the straw men that people like to set up and knock down. You can find out more about the movie here:
But I found the best part on YouTube. It is Danny DeVito's "Larry the Liquidator" speech:
Watch it when you get a chance. Not only is it entertaining but it is a learning experience (though I am not sure what you learn). Incidentally, it is much, much better than Michael Douglas's "Greed is good" speech in the first "Wall Street " which was a blatant rip-off of Ivan Boesky's graduation address to the UC Berkeley MBAs in 1986 (which I happened to be at, since I was teaching there that year).
2. DisneyWar: In next week’s session, I will be talking about the dysfunctional state of Disney in the 1990s. If you want to review these on your own, try this book written by James Stewart. It is in paperback, on Amazon:
If you want a more contemporary version of how Disney’s corporate governance is playing out, and want an insider’s perspective, Bob Iger’s autobiography is a solid bet:
3. Company Choice: On the question of picking companies for your group, some (unsolicited) advice:
As a final reminder. Please pick your company soon... As you can see from today's class, we are getting started on assessing your company…
4. If you want to download the financial statements for your company, I would recommend that you start with the annual report for the most recent year. You should be able to pull it off the website for the company, under investor relations. If you want to keep going, and it is a US company, go to o the SEC site (https://www.sec.gov/edgar). If it is a non-US company, you will have to find the equivalent regulatory body in your country. For some of your companies, you will find less data than on others. Don’t fret. It is what it is. Finally, I am attaching the post class test and solution for today’s session.
|
||||||||||||||||||
| 1/30/25 | t is never too early to start nagging you about the project. So, let me get started with a checklist (which is short for this week but will get longer each week. Here is the list of things that would be nice to get behind you:
In doing all of this, you will need data and Stern subscribes to one of the two industry standards: S&P Capital IQ (the other is Factset). It is truly a remarkable dataset with hundreds of items on tens of thousands of public companies listed globally, including corporate governance measures. To get access to Capital IQ, you need to ask for it, and the attached document leads you through the process. As with all things IT related, I am sure that there are glitches and if you find them, let me know.
This is the seventh or eighth email for the class. If you have not been receiving these emails (which means that you are reading this in the chronicles), it is worth noting that I don’t keep an email list for the class. I use the Google groups that Stern creates. In theory, students registered for the class should be on Albert (the NYU official registration/grading site), Brightspace and Google Groups, and the three should be synced, but this is a university. What should be true in theory is not always the case in practice. I can do very little to alter the Google groups. If you are finding yourself locked out of the email list, start with IT, and if they won’t help, I will figure out a way to add you in. If you are a non-Stern student, and have an email address that does not end in@stern.nyu.edu, note that you were assigned a stern email address when you joined this class, and you should be able to find that address. Here is what I got from IT when I asked:
Since you are teaching a Stern course, all your students, exchange and non-Stern, are provided with a Stern account and Gmail.
You can have them all head over to 'start.stern.nyu.edu' to activate their account.
I think I have exhausted my welcome, Until next time! Attachment: Capital IQ Access |
||||||||||||||||||
| 1/31/25 | First things first. As I noted yesterday, the DeepSeek story is a corporate finance, and one with the potential to alter the end game for an entire business (AI), with ripple effects for all of us. With the lead-in that I am an AI novice, and that I have far more insight into potato chips (salt and vinegar beats BBQ, and waffle style is the best) than silicon chips, I decided to put my thoughts down on paper (and it kept going and going). Here is the post that just went up five minutes ago:
There is no rocket science here, nor advanced finance, but I would love to get your thought.
Also, as promised, here is the first of the weekly in-practice webcasts. These are 10-15 minute webcasts designed to work on practical issues in corporate finance. This week’s issue is a timely one, if you are working on picking companies for your project (as you should be..). It is about the process of collecting data for companies, the first step in understanding and analyzing them. The webcast link is below:
It is a little dated (but I have been too lazy to update it), but I don’t think it is too painful to watch, and you may even find it useful. I have also put the link up on the webcast page for the class:
The webcasts for the first two classes should be on there, if you missed (physically, metaphysically or mentally) and the links to the project and syllabus that I handed out in the class. You can stream or YouTube the sessions, or download videos/audios. Also, if you joined the class late, you can get all emails sent up till today here:
Finally, have you had a chance to look at the weekly puzzle? If not, give it a shot by going here:
At the risk of nagging, please do get the lecture note packet 1 downloaded before Monday’s class. It is accessible on the webcasts page linked above. |
||||||||||||||||||
| 2/1/25 | As you start the weekend, I decided to butt in with the first of my newsletters. As you browse through it (and I hope you do), you will realize that this is not really news or even fake news. It is more akin to a GPS for the class telling you where we’ve been and where we plan to go. It is a good way to get a sense of whether you are falling behind on either the class or the project, especially as we get deeper into the class. On a different note, it looks like your groups and jelling and I will be playing matchmaker to get the rest of you in groups. So, the next step is to go into the class master list and enter the name of the company that you will be analyzing as soon as you have picked one:
https://docs.google.com/spreadsheets/d/1xsASDBhkGo_1WhivAMLMkhi_z6cyYFnv1Q9G4y2TN4I/edit?gid=0#gid=0
Enjoy your weekend and I will see you on Monday!
Attachment: Issue 1 (February 1) |
||||||||||||||||||
| 2/2/25 | No email | ||||||||||||||||||
| 2/3/25 | In today’s session, we spent almost a large chunk of out time on the assessment of where the power lies in a company. In the utopian world, the power lies entirely with shareholders, but in the real world, that is not often the case. It can lie with managers, if shareholdings are diffuse and shareholders are passive. It can lie with a subset of inside shareholders, who have large holdings and/or are part of incumbent management. In some cases, that power can come from having voting and non-voting shares. It can lie with governments, lenders or employees. The first step in understanding why a company does what it does is to assess the power structure, and I suggested that you look at the largest shareholders in the company. One source for this is Bloomberg, and while almost all of the information you will find on it can be found elsewhere, it does provide a convenient place to get information. The first step is finding a Bloomberg Terminal, and there are three on the fourth floor of KMEC, in the MBA Study Room. I have never used them, but reliable sources have told me that that the usernames and passwords are in the computer wallpers (they are BBREADING1, 2 or 3 and then a password that is Alpha, Delta or Gamma followed by numbers). Once you are able to get on the terminal, type in the name of your company and a bunch of listings on your company will show up. It may take a little trial and error, but you should eventually find your local listing of your stock. If you can get on a Bloomberg terminal, try this:
1. Press the EQUITY button
2. Choose FIND YOUR SECURITY
3. Type the name of your company
4. You might get multiple listings for your company, especially if it is a large company with multiple listings and securities. Try to find your local listing. For a US company, this will usually be the one with your stock symbol followed by US. For a non-US company, it will have the exchange symbol for your country (GR: Germany, FP: France, LN: UK etc...) It may take some trial and error to find the listing....
5. Type in HDS
6. Print off the first page of the HDS (it should have the top 17 investors in your company).
If you cannot get to a Bloomberg, much of that same information is available on Yahoo! Finance and other online financial data providers. Here is the Yahoo! Finance page for NVDA.
Check out the percent of shares held by insiders (includes founders, managers and individuals owning more than 5%) and by institutions. Then, check out the biggest players. You can see the growth of passive investing in the top two on this (and probably every other large cap company in the universe) - Vanguard and Blackrock, both of which have index funds that track the S&P 500. |
||||||||||||||||||
| 2/4/25 | In this week’s puzzle, I thought I would use the recent kerfuffle at the Adani Group to talk about corporate governance in family group companies., You can find the puzzle described here:
That puzzle points you towards two posts from my blog. In the first post, I wrote a long time ago, where trouble was brewing at the Tata Group, the family group controlling Tata Motors:
I note the pluses and minuses for shareholders from investing in family group companies. I then turn to my last year's post on the Adani Grop, a first-generation family group company founded by Gautam Adani. It is heavily focused on infrastructure business, is connected strongly to political power in India and has seen its market cap zoom over the last two years in particular. In the post, I look at the Adani Group's growth over time, and examine how it has become the focus of a US-based short seller in Hindenburg, which contends that the group has indulged in earnings and price manipulation, and that institutions have looked away.
In the post, I also look at the ownership structure for the Adani Group and note that not only does the group control 73% of the shares outstanding in the company, but that statistic has barely budged over the last decade, even as the company has grown massively. There is a valuation in the post, but I would like your focus to stay on corporate governance at Adani specifically and at family group companies, in general. The puzzle ends with five questions:
In terms of mechanics, how does a family keep its ownership stake intact as a company is growing?
Give it a shot and you don’t need a finance background or have anything to do with India to do it. It is all about power.
|
||||||||||||||||||
| 2/5/25 | The objective function matters, and there are no perfect objectives. That is the message of the last two classes. Once you have absorbed that, I am willing to accept the fact that you still don't quite buy into the "maximize value" objective. That is fine and I would like you to keep thinking about a better alternative with three caveats. First, you cannot cop out and give me multiple objectives - I too would like to maximize stockholder wealth, maximize customer satisfaction, maximize social welfare and employee benefits at the same time but it is just not doable. Second, your objective function has to be measurable. In other words, if you define your objective as maximizing the social good, how would you measure social good? Third, take your objective (and the measurement device you have developed) and ask yourself a cynical question: How might managers game this system for maximum benefit, while hurting you as an owner? In the long term, you may almost guarantee that this will happen.
Building on the theme of social good and stockholder wealth a little more, there are a number of fascinating moral and ethical issues that arise when you are the manager in a publicly traded firm. Is your first duty to society (to which we all belong) or to the stockholders (who are your ultimate employers)? If you have to pick between the two and you choose the former, do you have an obligation to be honest and let the latter know? What if you believed that the market was overvaluing your stock? Should you sit back and let it happen, since it is good for your stockholders, or should you try to talk the stock price down? On the question of socially responsibility, there are groups out there that rank companies based upon social responsibility. I have listed a few below, but they are a few of many:
JUST Capital: https://justcapital.com/rankings/
Calvert Social Index: https://www.calvert.com/calvert-indexes.php
Dow Jones Sustainability Index: https://www.spglobal.com/spdji/en/indices/esg/sp-500-sustainability-screened-index/#overview
And this is just the tip of the iceberg. Environmental organizations, labor unions and other groups all have their own corporate rankings. In other words, whatever your key social issue is, there is a way to stay true (as a consumer and investor). Notice how the rankings vary even across the ethics sphere. No surprise that no one has a monopoly on virtue. In the last few years, though, you have the ESG movement push for composite scores for companies, and that has created an eco system that I am cynical about, in terms of what will be ultimately accomplished. If you are interested in my perspective on ESG, please try these two posts that I have on the topic:
In addition, I did mention that the one thing that impact investing does not seem to measure itself on is actual impact, and here is the link:
Finally, to cement my standing as an amoral, unethical “cares only about money” standing, I wrote about the sacred cow that sustainability has become, and why it too may be heading for the slaughterhouse:
While it may seem like we are paying far too much attention to these minor issues, I think that understanding who has the power to make decisions in a company will have significant consequences for how the company approaches every aspect of corporate finance - which projects it takes, how it funds them and how much it pays in dividends. So, give it your best shot.. On a different note, we will be start on our discussion of risk on Monday. As part of that discussion, we will confront the question of who the marginal investor in your company is. If you have already printed off the list of the top stockholders in your company (HDS page in Bloomberg or the Major Holders page from Yahoo! Finance), bring it with you again. If you have not, please do so before the next class. Also, watch for the in-practice webcast day after tomorrow, because I will go through how to break down the HDS page. I am also attaching the post-class test & solution for this session.
|
||||||||||||||||||
| 2/6/25 | As for the project & class, time sure does fly, when you are having fun... We are exactly 15.38% (4 sessions out of 26) through the class (in terms of class time) and we will kick into high gear in the next two weeks. I am going to assume for the moment that my nagging has worked and that you have picked a company to analyze. Here is what you can be doing (or better still, have done already):
I will be putting up a webcast tomorrow on how to analyze the "top shareholder" list, using a range of companies. Hope you to get a chance to watch it. I also hope that you have had a chance to register for Capital IQ and if you have not, I am reattaching the directions on how to do so. |
||||||||||||||||||
| 2/7/25 | Ahead of Super Bowl weekend , I thought I would get in the in-practice webcast for this week and nag you about your project (yet again). Since these webcasts are directly connected to what you will or should be doing on the project, the best way to use them is to pick a company and use the webcasts to get the relevant parts of the project done. This webcast looks at ways to assess the corporate governance at your company, using HP from 2013 as an example. I use HP's annual report, its filings with the SEC and other public information to make my assessment of the company.
HP Annual Report: http://www.stern.nyu.edu/~adamodar/pdfiles/cfovhds/webcasts/corpgovHP/HPAnnual.pdf
You can find these links in my webcast page, and it looks at what information to use and how to use it to assess the corporate governance structure of a company. (Sorry about the striped sweater… Should have known better)….. |
||||||||||||||||||
| 2/8/25 | 1. Newsletter: First things, first. Your newsletter is attached for the week. As is usually the case, there is not much news there, especially if you have been coming to class.
2. Company choice & groups: I was checking the corporate finance master sheet:
https://docs.google.com/spreadsheets/d/1xsASDBhkGo_1WhivAMLMkhi_z6cyYFnv1Q9G4y2TN4I/edit?usp=sharing
I am glad that it is filling up, and thank you to those of you who have entered the company name. I will be emailing those of you who have no company choice yet, right after this email. So, please don’t panic when you get that email. I am just trying to push you towards a decision.
3. Corporate Finance Puzzles: I have been posting the puzzles that I send out each week on Brightspace in the discussion section. I know that you have lots of things to do, but if you want to discuss and debate, that forum works well. The first discussion was about stakeholders in companies and the second one about corporate governance at family group companies…
4. Blog post on hurdle rates: I just posted my sixth data update for 2025, looking at hurdle rates in businesses.
While I know that you have other things on your plate this weekend, this may be an excellent post for you to read while you watch the Super Bowl halftime show, since it is directly relevant to what we will be b doing next week in lass.
One final note. If you are having trouble opening links on my emails or my webpage, try switching browsers. Google Chrome has issues with links to stern server sites.. (Don’t ask… It will unleash a stream of frustration…)
Attachment: Issue 2 (February 8) |
||||||||||||||||||
| 2/9/25 | I hope that you will be watching the Super Bowl this evening, not prepping for corporate finance. That said, my point about everything being corporate finance applies starting with the insane amount of money that it will cost a network to carry the Super Bowl today (and whether you can make it back on ad revenues or whether you need the show to boost other shows revenues), whether the halftime show will boost the earnings of the entertainer in question and what these ads tell you about the businesses doing the advertising.. Inquiring minds want to know. So, as you much your chips and watch Mahomes throw the ball from angles that look physically impossible, start tallying up the numberers.
Tomorrow, we will complete our discussion of corporate governance and start with a discussion of risk and how it plays out in hurdle rates. In the process, we will talk about the model that started the ball rolling, the capital asset pricing model (CAPM, how it is mystified by some and vilified for others, often in advancement of their agendas, and about alternatives to i5. We will move through this discussion in hyper speed for two reasons. One is that I have zero interest in reinventing modern portfolio theory and showing the mechanics of correlation and covariance. The second is that while I use the CAPM as a tool to estimate hurdle rates, I am not wedded to it and accept all kinds of alternatives (some of which we will talk about in class). If you are still shaky about even the assumptions that underlie the model, my suggestion is that you read chapter 3 from the applied corporate finance book before the class. If you don’t have the book, or not in the mood to read an entire chapter, please read my data posts from this year
These posts will prepare you for what’s coming in the sessions after, we will start on the fun stuff of applying the model, starting with what should be a slam dunk (risk free rates) which is increasingly not and then turning to the equity risk premium, a number that analysts often turn towards services to look up but really has deep implications for both valuation and corporate finance. So, much to do and I hope that you come along for the ride. |
||||||||||||||||||
| 2/10/25 | We started the class by wrapping up the question of at the end game in business, and why I (and you don’t have have to) still trust markets, over managers and expert panels. Markets have no ego, and if allowed to play out, will devise corrections to almost every over reach in business, whether it be managers taking advantage of shareholders, borrowers ripping off lenders, companies lying to markets or creating large social costs. My view is that companies should run to maximize value, but that will involve accepts self-constraints on behavior, and even if the market does not recognize it right away, but that managers need to consider the messages in stock prices.
We then moved on to risk and some of you may be regretting the shift from the soft stuff , but trust me that it is still fun.. If it is not, keep telling yourself that it will become fun. Anyway, here are a few thoughts about today's class.
If you can, try to make your assessment of whether the marginal investors in your companies are likely to be diversified. Look at both the percent of stock held in your company and the top 17 investors to make this judgment. If your assessment leads you to conclude that the marginal investor is an institution or a diversified investor, you are home free in the sense that you can now feel comfortable using traditional risk and return models in finance. If, on the other hand, you decide that the marginal investor is not diversified, we will come back in a few sessions and talk about some adjustments you may want to make to your beta calculations.
|
||||||||||||||||||
| 2/11/25 | In yesterday’s class, we went through the intuitive derivation of the CAPM. I thought that this week’s puzzle should be built around the central themes of portfolio theory, which is that diversification is the best weapon against risk, since it eliminates firm specific risk. That view, though, gets push back from some big name investors, including some value investing legends and Mark Cuban (who is also a legend, at least in his own mind). You can start the puzzle by reading the arguments for and against diversification:
The evidence, from looking at investor behavior, is that most individual investors side with the latter than the former (though that does not mean that it is right):
I am going to surprise you with my view. While I am more inclined to diversify than not, I can also see scenarios where not diversifying makes sense. In fact, I have a blog post on the question of how much diversification is good for you (and the answer will vary across individuals):
This is a topic that is important not just for your finance class, but for your personal portfolios, as you accumulate wealth (I am assuming that this Stern MBA, which you are paying a hefty price for, will pay off). |
||||||||||||||||||
| 2/12/25 | We started today’s class by tying up the last loose ends with risk and return models, talking about how assuming that there are no transactions costs and private information can lead us all to hold the market portfolio, and how risk can be then measured as risk added to that portfolio. We did damn the CAPM with faint praise, arguing that it does not do very well at explaining differences in returns across companies, but that it does at least as well as the alternatives. We then started on the mechanics of the model, taking about risk free rates: how to estimate the risk free rate in a currency where there is no default free entity issuing bonds in that currency and why risk free rates vary across currencies. The key lesson is that much as we would like to believe that riskfree rates are set by banks, they come from fundamentals - growth and inflation. I have a post on risk free rates that you might find of use:
In fact, risk free rates turned negative in a few currencies, upending what we know about risk free rates in. Here is my post on negative risk free rates.
In the second half of the session, we turned to equity risk premiums and how they are related to risk aversion. More on that in the next class. By the way, we have no class next Monday and I hope to see you, rested and ready to go next Wednesday!
There is one final point related to overall class logistics that I want to highlight. As you have noticed, I do come at you incessantly with emails, things to watch (like the in-Practice videos) and things to do, and I do realize that given all of the stuff you have on your plate, it is easy to get behind and feel overwhelmed. I understand that feeling, and I recognize that you may have far less time than I think you do for this class. In the interests of working with constraints, here is my suggestion on what you should focus on, given the time that you can spend on this class (in addition to being in lecture or watching it online).
Busy, Multiple constraints on time including health, family etc.
Time available: <3 hours a week
1. Do post-class tests (10-15 minutes for each class)
2. Review lecture notes for the session (20-30 minutes for each class)
3. Bare minimum on project company (30 minutes/week)
4. In quiz week, work through at least three or four past quizzes (2018-2022) (3 hours every three or four weeks)
Busy, Significant constraints on time
Time available: 3-6 hours a week
1. Do post-class tests (10-15 minutes for each class)
2. Review lecture notes for the session (20-30 minutes for each class)
3. Watch in-practice video each week (30 minutes/week)
4. Get numbers crunched on project company (1 hour/week)
5. In quiz week, work through at least six to eight past quizzes (2015-2022) (5 hours every three or four weeks)
Busy, but class is key priority
Time available: 6-10 hours a week
1. Do post-class tests (10-15 minutes for each class)
2. Review lecture notes for the session (20-30 minutes for each class)
3. Watch in-practice video each week (30 minutes/week)
4. Get numbers crunched on project company & start narrative (1.5 hour/week)
5. Read and give weekly challenge a quick try (30 minutes/week)
6. Review practice problems for each section and try two or three in each section (30 minutes/week)
7. In quiz week, work through at least eight to ten past quizzes (2013-2022) (6 hours every three or four weeks)
Obsessed with this class
Time available: As many hours as needed
1. Do post-class tests (10-15 minutes for each class)
2. Review lecture notes for the session (20-30 minutes for each class)
3. Watch in-practice video each week (30 minutes/week)
4. Get numbers crunched on project company & start narrative + help other group members (2.5 hour/week)
5. Read and give weekly challenge a try and explore topic further (1 hour/week)
6. Review practice problems for each section and try four or five in each section (1 hour/week)
7. In quiz week, work through all past quizzes (1997-2022) (8 hours every three or four weeks)
8. Read stories in financial press, and craft your corporate finance response to each story (continuous)
With each of these, note that I have not set aside the time that it takes to read these long emails, and I am sorry for that. But I cannot think of a better tether to keep you connected to the class. (I could text you the emails, but I don’t think your phone can handle that barrage.)
Until next time!
|
||||||||||||||||||
| 2/13/25 | If my nagging is paying off, you should have picked a company by now and if you have, you can move on to look at the marginal investors in you company, with the objective of assessing whether they are diversified, since it will let you know whether you are on safe ground using the CAPM or any other risk and return model. This will require a degree of judgment, but remember that you are not trying to identify a particular investor (Blackrock, Vanguard etc.) but a type of investor (institutional, insider, individual etc.). In making this assessment, having access to a Bloomberg terminal can speed the process, and if you get a chance, look at the YouTube video that I sent to you about using Bloomberg. If you don’t have access to a terminal, never fear, since much of the data is public. You can get both the breakdown of investors into insider and institutional, as well as the top holders of your stock. Here for instance is the page for PlugPower, a US company listed on the NASDAQ (under Holders): https://finance.yahoo.com/quote/PLUG/holders?p=PLUG
The assessment of who the marginal investor in PlugPower is easy to make. It is a large institutional investor, and very diversified. You can see that 55% of PlugPower’s shares (and 61% of the float, i.e., shares that are being traded at not locked away) are held by institutions, and if you are wondering whether that is high or low, I have data on insider and institutional holdings, by sector, for US, Global, European, Emerging (with China and India as separate date sets), Japan and Australia/NZ/Canada. You can find them here:
Scroll down to insider/institutional holdings and download the excel spreadsheets. If you have fallen behind in this class, there is nothing to fear. You have a whole week to catch up, and if it looks overwhelming, you should start with the entry page for the class:
Everything that we have done so far (from the class sessions, to weekly puzzles to even past emails) should be here.
One final note. These emails go out to a Google group email alias that is maintained by Stern IT. In theory, it should be synced with Albert, which is the registration system. In practice, the two systems sometime don’t talk well to each other. So, if you joined the class late and you are not getting emails yet, it may be because it has synced your name into the list yet. If you dropped the class, and you are wondering why I keep harassing you, it is again the syncing problem, and it is one that I cannot fix. You can try to talking to IT, but you know how that usually goes… So, good luck! |
||||||||||||||||||
| 2/14/25 | Ahead of a long weekend, I decided that it would be a good time to send not one, but two, valuation webcasts this week. The first lt is on assessing who the top stockholders in your company are and thinking through the potential conflicts of interest you will face as a result. The webcast went a little longer than I wanted it to (it is about 24 minutes) but if you do have the list of the top stockholders in your company (the HDS page from Bloomberg, Capital IQ, Morningstar or some other source), I think you will find it useful.
Webcast link: http://youtu.be/x_H_4KTeOkc
Presentation link: http://www.stern.nyu.edu/~adamodar/pdfiles/cfovhds/webcasts/holders.ppt
I hope that you get a chance to not only watch these webcasts but also try them out on your company.
The second one is on the first of the three inputs into your cost of equity, the risk free rate. If you want to get ahead of the curve, you can watch the webcast for this week, which looks at how to estimate risk free rates in different currencies, and how sovereign default spreads can be useful in getting there:
Webcast: https://www.youtube.com/watch?v=imfy-O9QuVc&index=3&t=0s&list=PLUkh9m2BorqmRAGzJb5OIvTAKZZu9HWF-
Additional material:
These datasets are from 2013. The 2025 versions are attached. Have a great long weekend1 Attachments:
|
||||||||||||||||||
| 2/15/25 | Last week, we put the objective function to rest and turned our attention to risk models. Next week, is a shortened week, since we will not have class on Monday. We will continue with our discussion of how best to estimate risk premiums and convert them into hurdle rates. I This week’s newsletter is attached. Attachments: Issue 3 (February 15) |
||||||||||||||||||
| 2/15/25 | As you can see from the heading, this is an email to all my classes, and it is about how to collect data, without getting overwhelmed by it. In particular, I want to focus on, and provide some help on data from three sources: the company itself (annual reports, financial filings), Capital IQ (a database of all publicly traded companies, with immense amounts of accounting and market data on each) and the physical Bloomberg terminals that are in the business school:
1. The Company: About 75% of the information, perhaps more, still come from annual reports and financial filings made by the company and the best source for this information is in the original documents (rather than on online sources, no matter how sophisticated). I usually start by finding the company’s webpage, going to the investor section and finding the most recent annual and quarterly report, as well as the analogous financial filings (10K and 10Q for US companies). Download them in pdf format, because you can then use the search box to search for the data you need in the pdf. (Warning: Do not read the annual report, until you are ready in terms of what data you want from the report)
2. Capital IQ: I have sent you many reminders that you have access to S&P Capital IQ. It is one of the premier global corporate datasets, and given how expensive it is to access, we are lucky to have access at Stern.
If you have not already done so, access Cap IQ, find your company, and it is pretty self-explanatory. I just download into excel the income statement, the balance sheets, the cash flow statement and the segment data, and I replace the default time period (which is the last few years with the maximum period, which can 30 years or more for some companies). You now have all of the historical data that you will need for your company. While you are in Capital IQ, you can also check out the industry grouping that your company is in, screen for other companies like it (by industry group, geography, market cap etc.) and download the data you might need on those companies (I would start with betas, market capitalizations, total debt and cash, but you may need to come back to this list again later in the class). I put together a YouTube video on how to do this, if you are interested:
3. Bloomberg terminal: Find the Bloomberg terminals in the building; for MBAs, there are four on the fourth floor of KMEC, and for undergraduates, there are four in Tisch 316 (accessed through 305). Since these are scarce, and hogging the machines is not a good idea, I thought I would create a guide specifying not only what you need to print off for your company, as well as where to find data on those print outs. I used BP as my company, and the print out should reflect what the pages should look like now for your company:
You will note that there are only six Bloomberg groupings you should print out, ten pages, in all.
HDS: Just the first page
BETA: One page
DES: Five pages
DDIS: One page
CRPR: One page
FA: One page
If you play this right, it should take you 10-15 minutes for your company, and you should do it as soon as you can. I know that this is my second email to you today, but to compensate, I will skip emailing you tomorrow and day after. See.. I am a compassionate person. Attachments: Capital IQ Access, Bloomberg Guide |
||||||||||||||||||
| 2/18/25 | Hi,
As we are navigate our way through a volatile economy and market, it is a good time to think about our views on risk and how it plays out in how we react to the crisis. Both economics and finance are built on risk aversion, i.e., that investors need to be paid extra (over and above an expected value) to take risks. That notion of risk aversion has been challenged and modified over time, but it still is at the heart of how we measure risk and come up with expected returns. Economists agree that not only does risk aversion vary across individuals but it also varies, for the same individual, across time. In this puzzle, which has no right answer, I would like you to wrestle with the question of how risk averse you, explanations that you can offer for that risk aversion and the consequences for your business and investment decision making. You can find the full details of the puzzle here:
One of the side products of the growth of robo advisors is a proliferation of tools that investors can use to assess how risk averse they are. This article in the New York Times nicely sets the table. In the article, though the links to free risk assessment services are no longer free. There are, however, plenty of risk aversion tests online. Here’re a couple that you can try at no cost (though the second one is longer):
University of Missouri: https://pfp.missouri.edu/research/investment-risk-tolerance-assessment/
Take the tests, both to get a measure of how risk aversion gets measured and how risk averse you are as an individual. Then, try to answer the following questions:
In tomorrow’s class, we will complete our discussion of equity risk premiums and perhaps start on the assessment of betas. It would help if you have the beta page for your company (from Bloomberg) and can bring it with you...
|
||||||||||||||||||
| 2/19/25 | Today's class was spent talking mostly about equity risk premiums. The key theme to take away is that equity risk premiums don't come from models or history but from our guts. When we (as investors) feel scared or hopeful about everything that is going on around us, the equity risk premium is the receptacle for those fears and hopes. Thus, a good measure of equity risk premium should be dynamic and forward looking. We looked at three different ways of estimating the equity risk premium. It is with this objective in mind that we computed an implied equity risk premium for the S&P 500, using the level of the index. If you want to try your hand at it, here is my February 2025 update:
Play with the spreadsheet. In fact, try it with today’s index level and T.Bond rate and see what the ERP is right now. I also noted the path of historical implied equity risk premiums, and how they have become more unstable and higher since 2008, mentioning a greater fear of catastrophic risks than ever before. If you are interested in this topic, I wrote a piece about it last week:
I then extended this approach into other markets, and talked about how to (and tried to) estimate equity risk premiums for other markets, using the country ratings (default spreads) as a building block. You can get my 2024 start-of-the-year equity risk premiums at this link:
As a final step, see if you can find the geographic revenue distribution for your company. You can then use my latest ERP update to get the ERP for your company. If you can find production exposure, even better. You will then have to decide whether you want ERPs based upon production, revenues or a composite of the two.
Beta reminder: Pease do try to find a Bloomberg terminal (find the one on the fourth floor of KMEC). Click on Equities, find your stock (pinpoint the local listing; there can be dozens of listings....) and once you are on your stock's page of choices, type in BETA. A beta page should magically appear, with a two-year regression beta for your company. Print if off. If no one is waiting for the terminal, try these variations:
1. Time period: Change the default to make it about 5 years and the interval from weekly (W) to monthly (M). Print that page off
2. Index: The default index that Bloomberg uses is the local index (a topic for discussion next session). You can change the index. Replace your default index (usually the index of rte country in which your company is incorporated and traded with the MSCI Global Equity Ihdex in the index box and rerun the regression.
Bring the beta page (s) with you to the next class. Let's get the project done in real time, in class.
|
||||||||||||||||||
| 2/20/25 | As part of the weekly project nag, I am going to start by assuming that you have picked a company to analyze and that if you have not entered its name in the Google shared spreadsheet, it is an oversight that you will fix soon.
https://docs.google.com/spreadsheets/d/1xsASDBhkGo_1WhivAMLMkhi_z6cyYFnv1Q9G4y2TN4I/edit?usp=sharing
If you have not filled a company name, expect an email from me shortly, but it is more a nudge than a push. So, don’t freak out!
Here are some things to consider doing to catch up:
On a different note, the first quiz is a week from Monday (on March 3), and if you feel the urge, you can start preparing for it, though you may find the third question on each quiz a bit of a mystery at the moment. Here are some resources:
1. If you do want to practice, you can find the past quiz 1s that I have given for this class, with solutions, at the links below:
2. There is a review webcast that I did for the quiz. If you are interested, you can get it by going to: My advice on the quizzes is that you start with the most recent quizzes and work backwards, and with time constraints in mind, here is what I would recommendL On the earlier quizzes, you will notice that I don’t provide an ERP in problems, and that 5.5% shows up in the answer. That is because I expected people to look up the ERP in their lecture notes, and it was roughly 5.5% then, but I have learned my lesson the hard way and provide the ERP in the problem in recent years. |
||||||||||||||||||
| 2/21/25 | It is Friday and time for the in-Practice Webcasts. I have two for this week.
The first is on estimating implied equity risk premiums:
The second webcast is on company equity risk premiums, using operating exposure:
Updated ERP spreadsheet: http://www.stern.nyu.edu/~adamodar/pc/datasets/ctryprem.xlsx |
||||||||||||||||||
| 2/22/25 | No big news this week, since we had only one session, but a newsletter with just a little news nevertheless. Attachments: Issue 4 (February 22) |
||||||||||||||||||
| 2/23/25 | I hope that your weekend is going well. The coming week is going to be a big one on multiple fronts.
|
||||||||||||||||||
| 2/24/25 | In today’s class, we looked past regression betas at how the choices companies make about the businesses they enter can determine their betas.. Summarizing the class, here is what we listed as the three determinants of betas:
If you remember, we looked at the beta for Disney after its acquisition of Cap Cities in the class. The first step was assessing the beta for Disney after the merger. That value is obtained by taking a weighted average of the unlevered betas of the two firms using firm values (not equity) as the weights. The resulting number was 1.026. The second step is looking at how the acquisition is funded. We looked at an all equity and a $10 billion debt issue in class and I left you with the question of what would happen if the acquisition were entirely funded with debt. (If you have not tried it yet, you should perhaps hold off on reading the rest of this email right now)
Debt after the merger = 615+3186 + 18500 = $22,301 million ( Disney has to borrow $18.5 billion to buy Cap Cities Equity and it assumes the debt that Cap Cities used to have before the acquisition) Equity after the merger = $31,100 (Disney's equity does not change) D/E Ratio = 22,301/31,100= 0.7171 Levered beta = 1.026 (1+ (1-.36) (0.7171)) = 1.497 Note that I used a marginal tax rate of 36% for both companies, which was the case in 1996. That’s about it for now, but your quiz is next Monday. More on that in a different email.
|
||||||||||||||||||
| 2/25/25 | This week’s puzzle is on betas and I have used GameStop as my lab experiment. First, check out the description of the puzzle (with the beta pages for both companies):
Once you have browsed through it, here are the questions that I would like you to consider
Just a reminder again that the first quiz is on March 3 (next Monday). The TAs, Justin and Guilherme, are both incredibly knowledgeable and helpful and I will add office hours this weekend for questions that you may have.
On a different note, if you have been checking the calendar, you will probably see a case due on March 19. If you are wondering what that case is, I thoughr I would resolve the mystery and send you the case today. You have three weeks to work on it, and some of the material for the case has not been covered in class yet, but it will help if you can quickly browse through the case.
It is a group case, and dividing some of the labor will help you. But I will let you figure out that process.
|
||||||||||||||||||
| 2/26/25 | In this session, we continued the discussion of betas being weighted averages, and used the concept to estimate the beta for Disney, starting with its businesses and working up to the beta of the company, and we repeated that process with the other companies in our mix - Vale, Tata Motors, Baidu and Deutsche Bank. We ended the class by talking about how to estimate the cost of equity, when an investor/buyer is not diversified, and noted that this can explain why private companies end up as parts of publicly traded companies.
If you feel the urge to estimate the betas of the businesses that your company operates in on your own, please do so, but I do have betas estimated by industry for various groups on data page. The US, emerging market and global averages are linked below, but you can find similar averages for Japanese, European, Indian and Chinese companies:
Emerging Markets: https://pages.stern.nyu.edu/~adamodar/pc/datasets/betaemerg.xls
I also have total betas by industry and for different regional sub-groupings, if you are interested.
|
||||||||||||||||||
| 2/27/25 | Today is usually the project update day. If you really have the time for it, this is a good week to get a bottom up beta for your company and estimates costs of equity for each business line it operates in. I You can get betas by business going to my website:
If you scroll down, you will set betas (levered and unlettered), by business and while the html file includes only US companies, you can download the averages for the rest of the world in the next column. If you prefer to compute your bottom up betas yourself, you can use other databases, but the one that is easiest and most comprehensive is the S&P Capital IQ database. Early this semester, I had sent you instructions on how to get access that database, and if you have not, try to do so now. (See attached instructions.. I know… I know.. I’ve sent it four times already, but just in case...). It provides you incredibly powerful screening tools with 50000+ publicly traded companies, and very simple ways of picking the data you need and downloading that data into a spreadsheet.
The quiz is on Monday, in the first 30 minutes of class, and please take advantage of the TAs for the class, Justin and Guilherme. I am in Portugal today through Saturday, but will be back by mid-afternoon Sunday, and will have office hours on Sunday from 5 pm - 7 pm.
Join URL: https://nyu.zoom.us/j/99520086506
If you are looking for past quizzes and the quiz review, the links are below:
A mea culpa on the quiz solutions. I must have been out of it when I put together the spring 2022 solutions, because there were at least two problems where the answers were off (the second problem where I estimated a cost of equity in Colombian pesos when the problem specified Sul) and the third problem where my solutions suggested a $400 million borrowing, when it was actually $800 million. In my defense, there were two versions of the quiz, and the solution I sent you was for the wrong version. They have been fixed now, and you can download the correct version.
|
||||||||||||||||||
| 2/28/25 | If you want to take time away from preparing for the quiz, in this week’s webcast, I take a look at Disney's 2-year weekly regression (from February 2011- February 2013). I have the Bloomberg page attached. I am also attaching the spreadsheet that I used to analyze this regression, which you are welcome to use on your company. The webcast is available at the link below:
Disney’s Regression Bloomberg beta page: https://www.stern.nyu.edu/~adamodar/pdfiles/cfovhds/webcasts/Regression/Disneyregression.pdf
The best way to make this stick is to try this on your company quickly.
I also have a webcast on the mechanics of estimating bottom up betas. I use United Technologies to illustrate the process and I go through how to pull up companies from Capital IQ. Even if you don't get a chance to watch it after the quiz, it may perhaps be useful later on. Here are the links:
United Technologies 10K: https://www.stern.nyu.edu/~adamodar/pdfiles/cfovhds/webcasts/Bottomupbeta/UT10K.pdf
Spreadsheet to help compute bottom up beta: https://www.stern.nyu.edu/~adamodar/pdfiles/cfovhds/webcasts/Bottomupbeta/bottomupbeta.xls
The last spreadsheet has built into it the industry averages that I have computed for different sectors in the US in 2015. You can get the updated version from 2023 here:
The quiz is on Monday, in the first 30 minutes of class, and please take advantage of the TAs for the class, Justin and Guilherme. At the risk of repeating myself, I will have office hours on Sunday from 5 pm - 7 pm.
Join URL: https://nyu.zoom.us/j/99520086506
|
||||||||||||||||||
| 3/1/25 | First, it is the weekend and the newsletter is attached. Second, and perhaps more important, your quiz is on Monday. I will not repeat all the links again, but I will have office hours tomorrow from 5 pm - 7 0m and the zoom link is below:
Attachments: Issue 5 (March 1) |
||||||||||||||||||
| 3/2/25 | The quiz is definitely tomorrow in the first 30 minutes of class and just to repeat what has been said before, it is
- open book and open notes
- you can use your tablets and laptops for reviewing your slides and other material
- you can use abacuses, slide rules and calculators (physical or digital), but no excel.
. As I get emails about the quiz, I thought it would be a good idea to pull together a list of the top emailed questions that I have received so far.
1. Why do we use past T.Bill rates for Jensen's alpha and the current treasury bond rate for the expected return/cost of equity calculation?
The Jensen's alpha is the excess return you made on a weekly/monthly basis over a past time period (2 years or 5 years, depending on the regression). Since you are looking backwards and computing short-term (monthly or weekly) returns, you need to use a past, short-term rate; hence, the use of past T.Bill rates. The cost of equity is your expected return on an annual basis for the long term future. Hence, we use today's treasury bond or long term government bond rate as the riskfree rate. 2. How do you decide whether to use a historical or an implied equity risk premium? In a market like the US, with a long and uninterrupted history, the choice depends on whether you believe that things will revert back to the way they were (in which case you may decide to go with the historical premium) or that the world is a dynamic, ever-shifting place, in which case you should go with the implied premium. In most other markets, where you don't have a long history, it is not really a choice, since the historical premium is too noisy (big standard error) to even be in contention. Thus, I use a short cut. If it is a AAA rated country like Germany or Australia or Singapore, I use the US equity risk premium, arguing that mature markets need to share a common premium. If it is not a AAA rated country, see the answer to (4). 3. How do you estimate a riskfree rate for a currency in an emerging market? If you are doing your analysis in US dollars or Euros, you would use the riskfree rates in those currencies: the US treasury bond rate for US dollars and the German Euro bond for the Euro. In the local currency, you should start with the government bond rate in the local currency and take out of that number any default spread that the market may be charging (see the Mexico example in the review packet). The default spread can be obtained in one of three ways: (a) The difference between the rate on a dollar (Euro) denominated bond issued by the country and the US treasury bond rate (German Euro bond rate), (b) CDS spread for the country or (c) typical default spread given the local currency rating for the country. As to which one you should use in a problem, the problem will almost always push you in one of the three directions. Don’t fight it. 4. How do you adjust for the additional country risk in companies that have operations in emerging markets? If the country you are analyzing is not AAA, you should adjust for the risk by adding an "extra" premium to your cost of equity. The simplest way to do this is to add the default spread for the country bond to the US risk premium. This will increase your equity risk premium and when multiplied by your beta will increase the cost of equity. A slightly more sophisticated approach is to adjust the default spread for the relative risk of equities versus bonds (look at the Mexico example in the review) and adding this amount to the US premium. This will give you a higher cost of equity. If you are given enough information to do the latter, do it (rather than use just the default spread). When assessing the equity risk premium for a company, look past where the company is incorporated at where it does business. The equity risk premium that you use should be a weighted average of the equity risk premiums of the countries in which the company operates. 5. Why do you use revenues (rather than EBIT or EBITDA) as the basis for your weighting for ERP? Note that what you would really like to know is the value of a company's different businesses/geographies, but since you don't have value, you look for proxies. While you may have a choice of different measures (revenues, EBITDA, EBIT etc), I prefer revenues for three reasons. First, it is always a positive number, which is good since I want weights that are greater than zero. Second, it is less susceptible to accounting allocation judgments than numbers lower down on the accounting statement. Third, I can convert it into a value by using an EV/Sales multiple, which I can get from the sector. 6. Why do you use the average debt to equity ratio in the past to unlever a regression beta? The regression beta is based upon returns over the regression time period. Hence, the debt to equity ratio that is built into the regression beta is the average debt to equity ratio over the period. 7. What is the link between Debt to capital and debt to equity ratios? If you have one, you can always get the other. For instance, the Fall 2006 quiz gives you the average debt to capital ratio over the last 5 years of 20%. The easiest way to convert this into a debt to equity is to set capital to 100. That would give you debt of 20 and equity of 80, based upon the debt to capital ratio of 20%. Divide 20 by 80 and you will get the debt to equity ratio of 25%. 8. How do you annualize non-annual numbers? The most accurate thing to do is to compound. Thus, if 1% is your monthly rate, the annual rate is (1.01)^12-1.... if 15% is your annual rate, the monthly rate is (1.15)^(1/12) -1... When the number is low, as is usually the case with riskfree rates, you can use the approximation of dividing by 12 (to get monthly) or 52 (to get weekly). But try to always compound the Jensen's alpha numbers, since they can be much bigger. 9. What is the cash effect on beta? Why does it sometimes get taken out and sometimes get put back in? I know that dealing with cash is on of the more confusing aspects of beta and cost of equity. Let's start with some basics. If a company has cash on its balance sheet, that cash is an asset with a zero beta (or at least a very low one) and it will affect the beta for the company and the beta that you observe for its equity (say, from a regression). What you do with cash will therefore depend upon what beta you are starting with and what beta you want to end up with. For the pure play or unlevered beta by business: You start with the average (or median) regression beta across the comparable companies in the business. To get to a pure play beta for the business, here are the steps: Step 1: Unlever the regression beta, using the gross debt to equity ratio for the sector Unlevered beta for median company in sector = Regression beta/ (1+ (1- tax rate) (Debt/Equity Ratio for the sector)) Step 2: Clean up for the cash held by the typical company in the sector, using the median cash/ firm value for the sector (see below for firm value) Unlevered beta for the business = Unlevered beta for median company/ (1 - Cash/Firm value for the sector) Note that you use sector averages all the way through this process, for regression betas, debt to equity ratios and cash/firm value Alternatively, you can use the net debt to equity ratio and cut it down to one step Net Debt to Equity = (Debt - Cash)/ Market value of equity Unlevered beta for the business = Levered Beta for median company /(1+ (1-tax rate) (Net Debt to Equity)) To get to the bottom up equity beta for a company: You start with the unlevered betas with the businesses and work up to the equity beta in the following steps: Step 1: Compute a weighted average of the operating business betas, using the values of the operating businesses in the company: Unlevered beta for operating assets of the company = Pure play betas weighted by values of the operating businesses Step 2: Compute a weighted average of all of the assets of the company, with the company's cash included (since cash has a beta of zero) Unlevered beta for entire company = Unlevered beta for operating assets (Value of operating assets/(Cash + Value of operating assets)) Step 3: Compute a levered beta for just the operating assets of the company, using the debt to equity ratio of the company Levered beta for operating assets of the company = Unlevered beta for operating assets (1+ (1- tax rate) Company's D/E ratio) Step 4: Compute a levered beta for all of the assets of the company, with cash included Levered beta for all assets of the company = Unlevered beta for entire company (1+ (1- tax rate) Company's D/E ratio) It is the beta in step 4 that is directly comparable to your regression beta. Note that all the numbers in this part are the company's numbers - for values for the businesses, cash holdings and debt/equity. 10. Why do you weight unlevered betas by enterprise value (as you did in the Disney/Cap Cities acquisition) and in computing Disney's bottom up beta? The unlevered beta is a beta fo the asset side of the balance sheet, right? So, when weighting these unlevered betas, you want to weight them by how much the businesses are worth (and not how much the equity is worth). That is why I used enterprise value weights in the Disney bottom up beta computation. I cheated on the Cap Cities acquisition by ignoring cash for both Disney and Cap Cities, but if cash had been provided, I would have used enterprise value. In case you are a little confused about the different values, here they are:
Sorry about the long email… and hope to see you at the zoom session (and I will record it).
|
||||||||||||||||||
| 3/3/25 | I know that sitting in a class after a quiz is tough to do, and I thank you if you did so. In the quiz -shortened session, we first defined debt broadly as including all contractual obligations, thus encompassing all interest bearing debt and leases. We then argued that the cost of deb tis a long term rate of borrowing money today, and is thus composed of a riskfree rate and a default spread. With rated companies, we can use the rating to get a spread, but for non-rated companies, you have to use the interest coverage ratio to get a synthetic rating, and then use that rating to get a default spread. With companies in risky countries, you should be adding the country default spreads to the riskfree rates to get to the cost of debt. Finally, we have to bring in the tax savings that accrue from being able to net interest expenses out to get to taxable income, by multiplying the cost of debt by (1- marginal tax rate). So, until you get my email about your quizzes, that’s about it. |
||||||||||||||||||
| 3/3/25 | Your quizzes are done and can be picked you. I am sorry for sending you the notification late in the evening, and I don’t expect you to do much about it right now.
Attachments: Quiz 1, solution and grade distribution |
||||||||||||||||||
| 3/4/25 | As you have learnt by now, I am a relentless nag, and I will continue on that mission. Before I get to the nagging, I want to deal with some of the quiz 1 answers where you and I might have disagreed and explain more fully my choices.
With all of that said, there is no point beating yourself up about things done and undone, and as I said, if you truly feel that you have been unfairly graded, bring it up with me (and not with the TAs, since they had nothing to do with it).
On a different note, if you look at your syllabus, you will notice a case worth ten percent, and if you are wondering what the case is about, and when you will be able to read it, it is your lucky day. Rather than give you a puzzle, I am posting the case with one of the exhibits as an excel spreadsheet:
It is a case built around an investment analysis and it is a group project about Celsius, the beverage company that took the market by storm in the last few years, before running into headwinds The project is a group project, and is due by March 19, 2025, before the start of class. It would make sense for the group that you have formed for your final project to be group for the case as well, but if you are a group of eight, and want to do the case as two groups of four, I am okay with that too. I know that you have two weeks, but I would suggest reading it right away and doing it in bite size pieces. I think you should get started on the case as soon as you can, with what you can do. For instance, one of the things you will need to estimate is a discount rate for the project, and much of what we have done in class in the last few sessions should help, and if you read it, the next couple o sessions should help you on the rest of the analysis.
|
||||||||||||||||||
| 3/5/25 | In this session, we first completed our discussion of hurdle rates, by looking at computing market values of debt (drawing on bond pricing), and then talking about when you use the cost of equity and when the cost of capital as a hurdle rate. Our discussion of investment returns began with the “Show me the money” theme from Jerry Maguire, and why we use cash flows, not earnings, in measuring investment returns, After making an argument for the primacy of cash flows, we looked at how a good measure of return is time weighted and incremental and how every investment is a project (small or large). We spent the bulk of the class describing the Rio Disney investment, and then computing the return on capital on that investment, based upon expected revenues and operating income. We will continue with that discussion next class. |
||||||||||||||||||
| 3/6/25 | Today is also usually the day that I write to you about your project, but if you are budgeting your time to immediate priorities, you should be working on the case. I know that you are heading off for spring break, but In case your fascination with corporate finance leads you to work on the case, here are a few suggestions on dealing with the issues.
I have to warn you in advance that there are parts of the case where I have deliberately not given specific assumptions, because I want you to make your own, and check for consistency. |
||||||||||||||||||
| 3/6/25 | File this away under “There is no rest for the wicked”, as I bring you back to the your project. Assuming that you have been working along with me, by now, you should have a risk free rate in the currency of your choice, an unlettered beta reflecting the business or businesses that your company is in and the equity risk premium that you have for your company. To get the unlevered beta to a levered beta, you need market values for equity and debt. With a publicly traded company, the former should be easy (market capitalization of all classes of shares) but the debt can be tricky. You should at least be able to get a book value of debt from the balance sheet (remember to count both short term and long term interest bearing debt), and if your company has leases and is following either GAAP or IFRS, the lease debt should also be there. If you don’t trust accountants, and want to do this right, you can covert book debt to market debt and capitalize leases for your company, but you will need a cost of debt for your company to be able to do this, and you can get that using either an actual rating or a synthetic rating for your company. I have a ratings spreadsheet that will do both (compute a synthetic rating for a company and capitalize leases. This is the link that I sent out yesterday:
Once you have all these numbers, you can compute a cost of capital. I know that you may be several steps behind, but if you do get to this number, please remember to go to the Google shared spreadsheet and enter your numbers for your company:
https://docs.google.com/spreadsheets/d/1xsASDBhkGo_1WhivAMLMkhi_z6cyYFnv1Q9G4y2TN4I/edit?usp=sharing
If you get to this point and want to compare your company’s cost of capital to others in the industry, at the start of 2024, you can find industry averages on my website, under current data.
Scroll down to the cost of capital section. |
||||||||||||||||||
| 3/7/25 | At this stage in the class, if you can compute a cost of capital for your company (or multiple costs, if it is many businesses), you will be all caught up. You are welcome to use my data and spreadsheets and the in-practice webcasts as crutches in doing this. I have added a webcast on estimating cost of debt and debt ratios, using the Home Depot as an example.
In the near term, I also want to remind you that the case is live, and that it is due a week from next Wednesday (on March 19) before class. You can find the case at the link below:
Please do read it, even if you don’t plan to or have time to work on it right away. It is a group project. So, at some point you will need to get together (physically or virtually) to talk about it.
Finally, while you don’t need Capital IQ for this case, you may want to use it for your project, and I got an email from NYU Library on access changes, and I thought I should forward her email.
I am reaching out from the NYU Libraries E-Resources unit regarding access to Capital IQ. A few students who were having trouble with this resource mentioned they are taking one of your classes. Access instructions for Capital IQ have changed and we wanted to make sure you are aware of the new requirements: https://guides.nyu.edu/az/databases?q=capital%20iq
Namely, users should start with the Database A-Z link listed instead of registering on the platform directly since authentication is now through single sign-on. Additional requirements are listed in the More Info section of the A-Z entry. Please let us know if you have any questions about this - thank you!
|
||||||||||||||||||
| 3/8/25 | Hi,
The newsletter for this week is attached, and as you can see, we are approaching the investment analysis section of corporate finance. There are two issues that I will nag you on:
1. Project: On your project, you have everything you need to compute the cost of capital for your company, and its divisions. Please do so, while you still remember, and at the risk of nagging you for the hundredth time, please input your assessment of corporate governance (on a scale from 0, where shareholders have no power, to 2, where they are in the drifter’s seat) and risk numbers (beta, equity risk premium) you have computed already into the master Google sheet:
https://docs.google.com/spreadsheets/d/1xsASDBhkGo_1WhivAMLMkhi_z6cyYFnv1Q9G4y2TN4I/edit?usp=sharing
2. Newsletter: The newsletter for this week is attached.
Attachment: Issue 6 (March 8) |
||||||||||||||||||
| 3/9/25 | I hope that you enjoyed your Sunday! In the week to come, we will get into the nitty gritty of estimating cash flows for a project analyses, using a new Disney theme park in Rio (Yup.. I made it up, but like a docudrama which is loosely based on facts, this is a docuproject). Since this is ground zero in the Celsius Eats case (and don’t you dare ask me, what Celsius Eats?), I would very strongly recommend that you at least read the case today. I have attached it again, if you missed the links I sent before. (That is my passive aggressive way of asking you to open it this time….) It will make the class sessions not only more understandable, but perhaps lead to some aha moments during class. | ||||||||||||||||||
| 3/10/25 | We started this session with a discussion of the right hurdle rate for the Rio Disney theme part, and argued for using the cost of capital for theme parks, adjusted for country risk. We then moved on to looking at accounting returns both for the project and at the company-level as a measure (crude, but still useful) of whether a company is earning more or less than its cost of capital, Returning to the project, we looked at the adjustments that need to be made to get from earnings to cash flows (depreciation, cap ex and working capital) and from cash flows to incremental cash flows (sunk costs, allocated expenses) and then to time-weighted incremental cashflows (discounting and time value). We concluded that the Rio Disney project is a good one, both in terms of NPV and IRR, We ended the class by examining why switching the currency to Brazilian reals has no effect on NPV, since both the discount rate and the expected cash flows are changed by the expected inflation differential. If you can apply this to your case, you should be in a good place. |
||||||||||||||||||
| 3/11/25 | We talked about sunk costs in class this week, and how difficult it is to ignore them, when making decisions. You can start your exploration of the sunk cost fallacy with this well-done, non-technical discourse on it:
http://youarenotsosmart.com/2011/03/25/the-sunk-cost-fallacy/ You can then follow up by reading a tortured Yankee fan's (my) blog post on the Yankee's A Rod problem and the broader lessons for organizations that have made bad decisions in the past and feel the need to stick with them. http://aswathdamodaran.blogspot.com/2012/10/the-yankees-rod-problem-sunk-costs-and.html Of course, this may be a question that the Dodgers may face with Shohei Ohtani and the Yankees with Aaron Judge sooner rather than later. It seems to be baked into sports contracts in baseball, but less so in the NFL.
Finally, I know that you are probably busy working on your case (spare me my illusions) but in case you have some time, I would like to pose a hypothetical, just to see how you deal with sunk costs. Before you read the hypothetical, please recognize that I am sure that the facts in this particular puzzle do not apply to you, but act like they do, at least for purposes of this exercise: http://people.stern.nyu.edu/adamodar/New_Home_Page/cfpuzzles/cfspr23puzzle6.htm I hope you get a chance to give it a shot. It will take only a few minutes of your time (though it may take a few years off your life |
||||||||||||||||||
| 3/12/25 | I started the class by talking about ways of dealing with uncertainty, ranging from payback to simulations. I also mentioned Edward Tufte’s book on the visual display of information, and you can find it at this link:
If, like me, you find yourself fascinated by simulations, but your statistics is a little rusty, you can try this paper I have on statistical distributions.
You don’t have to read the whole paper, just the appendix. I have attached the post class test for today, with the solution. In the final part of the class, we looked at tiat extensions of investment analysis for an investment show for Disney Plus, an iron ore mine for Vale and an acquisitions. The principle of matching cash flows to discount rates cut through all the examples, but the Vale iron ore mine looks at how cash flows vary when looked at through equity investor eyes. I hope that you get a chance to work on the case this weekend, and while I will be on the road in Greece, I will check my emails for any questions that you may have.
Finally, if you were on zoom today, and you got not audio, there was a problem with the technology, but I have a backup recording, using a different system. You can watch the class here:
The downloadable versions will be available later today.
|
||||||||||||||||||
| 3/13/25 | Today is also usually the day that I write to you about your project, but if you are budgeting your time to immediate priorities, you should be working on the case. I know that you are heading off for spring break, but In case your fascination with corporate finance leads you to work on the case, here are a few suggestions on dealing with the issues.
I have to warn you in advance that there are parts of the case where I have deliberately not given specific assumptions, because I want you to make your own, and check for consistency. |
||||||||||||||||||
| 3/14/25 | As we approach the last week before we leave for spring break, I am posting ga webcast on how to compute accounting return on capital (and equity), a measure that we talked about in class last week. I also have posted the review session for the quiz, even though it is not until April 7.
1. In-practice webcast: It covers the question of whether your company's existing investments pass muster. Are they good investments? Do they generate or destroy value? To answer that question, we looked at estimating accounting returns - return on invested capital for the overall quality of an investment and the return on equity, for just the equity component. By comparing the first to the cost o capital and the second to the cost of equity, we argued that you can get a snapshot (at least for the year in question) of whether existing investments are value adding. The peril with accounting returns is that you are dependent upon accounting numbers: accounting earnings and accounting book value. In the webcast, I look at estimating accounting returns for Walmart in March 2013. Along the way, I talk about what to do about goodwill, cash and minority interests when computing return on capital and how leases can alter your perspective on a company. Here are the links:
Webcast: https://youtu.be/An2SduBDYQE
Walmart: https://www.stern.nyu.edu/~adamodar/pdfiles/cfovhds/webcasts/ROIC/walmart10K.pdf (10K for 2012) and http://people.stern.nyu.edu/adamodar/pdfiles/cfovhds/webcasts/ROIC/walmart10Klast%20year.pdf(10K for 2011) Spreadsheet for ROIC: https://www.stern.nyu.edu/~adamodar/pdfiles/cfovhds/webcasts/ROIC/walmartreturncalculator.xls
Note that at the time that I did this, leases were treated as operating expenses, and I had to to do the conversion. Today’s accounting does treat leases as debt, and that should make your life easier, since you can just include the lease debt from the balance sheet in total debt, and skip the conversion process. The updated version of this calculator is attached to this email. I hope you get a chance to watch the webcast. It is about 20 minutes long. 2. Quiz 2 review session: I know the quiz is not until April 7, a week after you come back from spring break, but we have covered a great deal of the material you will need to try the quizzes. If you are bored, and want to get an early start, here you go:
You can also find all past quizzes with the solutions in the following links:
Finally, the case is a more complicated version of almost anything you will run into on the quiz. Until next time!
|
||||||||||||||||||
| 3/16/25 | First, the weekly newsletter is attached to this email. Second, I do have a post where I try to seek to find some balance in a world that is changing on Trump, tariffs and Tesla (three hot button topics, that are almost guaranteed to open up the cauldron of politics). I try my best to steer away from the politics (though not always successfully)) but I hope that you find it interesting:
Attachments: Issue 7 (March 15) |
||||||||||||||||||
| 3/17/25 | In this session, we started by comparing NPV versus IRR as decision rules, and why they might yield different answers for mutually exclusive projects, of both same and different lives. Our conclusion was that there is absolute best rule to follow for all companies, since it will depend on your position in the life cycle and access to capital. We then moved on to look at the side costs and benefits embedded in most investment decisions, and why these have to be brought into the analysis, looking at opportunity cot and product cannibalization as examples of side costs and synergies as side benefits. Just a final reminded, that the case is due before class on Wednesday. We will spend much of the class using the analysis to draw general lessons. Please remember to send me your analysis as a pdf file, with the rest of your group ccd not email, with “Celsius Eats”, as the subject, and the summary numbers on the cover page (NPV, IRR, ROIC, Accept/Reject). |
||||||||||||||||||
| 3/18/25 | I know that you are busy working on the case (or you may be done) but here is the weekly puzzle for this week. We have been talking, in class, about investment decisions and how best to make them. While we laid out the framework of forecasting cash flows and computing NPV, the reality is that you make the best decisions that you can, with the information that you have at the time, and the real world then delivers its own surprises. In this week’s challenge, I confront this issue head on by looking at Chevron’s $54 billion investment in a natural gas plant in Australia. The decision was made in 2009, when oil and gas prices were much higher and rising, and the plant is just going to start production. Take a look at the challenge:
Once you have read the puzzle, try to answer the following questions:
These are fundamental questions that get asked almost every time a big investment goes bad. Some times, investments go back because they should never have been taken in the first place, but some times investments go bad because the macro environment changed. |
||||||||||||||||||
| 3/19/25 | Thank you for getting your project reports and findings in on the Celsius case. The case presentation and case analysis (Excel file links) are below:
While we did spend time on the details of the case, here were some general lessons that I hope you take away:
1. When a project creates cash flows in different businesses with different risks, the discount rates used have to reflect those differential risks. I kept the cash flows separate for food and beverages and used different costs of capital for each one.
2. When a project uses up a resource, you have to factor that cost in, but you have to do so by looking at what will happen if you do not take the project as well. In the context of capacity, the clinic project will lead to capacity being used up earlier (in year 5) rather than later (in year 11). It is the difference in the present values of these costs that should be considered, not just the cost of investing in year 5.
3. When you decide to alter a project from finite life to a longer life, you have to behave differently in how you manage the project from the very beginning. In short, lengthening a project life is a trade off, where you settle for lower cash flows over the project life, in return for a higher ending value. In Celsius Eats terms, this will show up as more capital maintenance expenditures with the longer life than with the finite life.
After the case, we looked at side costs and side benefits from projects, and how it is critical that we go beyond the hand waving (it is strategic, or good things will happened) to trying to make our best estimates of these costs and benefits and bringing them into the analysis.
|
||||||||||||||||||
| 3/20/25 | First, my thanks for the time and sweat that went into the case reports. I appreciate it and if you are disappointed with your grade, I am truly sorry. I think all the cases are done and you should have got them already. Since I am getting on a flight to San Diego right now, and have never found flight wifi to be worth it, I am sending you this email before I leave, so that you can check your numbers against mine, and against the grading template. As a few of you noted, the links I sent you the presentation and the case analysis that I sent you yesterday directed you to a Costco Clinic presentation/analysis instead of the Celsius analysis. I am attaching the links to the case presentation from yesterday, the excel spreadsheet containing the case analysis and the grading codes that I had sent you before, so that you can make some sense of your grade.
Case presentation from yesterday: https://pages.stern.nyu.edu/~adamodar/pdfiles/cfexams/CelsiusPresentation.pdf
Case analysis (excel): https://pages.stern.nyu.edu/~adamodar/pdfiles/cfexams/CelsiusEatssoln.xlsx
Case grading template (pdf): https://pages.stern.nyu.edu/~adamodar/pdfiles/cfexams/CelsiusGrading.pdf
If you feel that i have missed something in your analysis, please make your argument. I am always willing to listen. Here are some thoughts:
1. Beta and cost of equity: The only absolutes I had on this part of the case was that you could not under any conditions justify using Celsius beverage beta to analyze a project in a different business and that you cannot use book values to come up with weight. However, I was pretty flexible on different approaches to estimating betas from the list of foodcompanies. Also, if you used that cost of capital to discount the synergy benefits to the retail business. I did not make an issue of it in this case, since the differences were small, but something to think about. On the issues of estimating beta from a peer group, a couple of suggestions:
2. Cost of debt and debt ratio: The cost of debt was given, though a few of you did forget to after-tax the cost of debt. Some of you made your lives difficult by computing a book interest rate, obtained by dividing the interest expense by the book value of debt. Let me assure that there is no place in corporate finance and valuation where that will work.
3. Cash flows in the finite life case: I won't rehash the arguments about why we need to look at the difference between investing in year 5 and year 11 for computing the cost of the expansion . Some of you either ignored the savings in year 11 or attempted to allocate a portion of the investment in year 5, a practice that is fine for accounting returns but not for cash flows. But here were some other items that did throw off your operating cash flows:
4. Cash flows in the longer life case: The key in this scenario is that you need more capital maintenance, starting right now. (Here is a simple test: If your after tax cash flows from years 1-15 are identical for the 15-year life and longer life scenarios, you have a problem...) Though some groups did realize this, they often started the capital maintenance in year 16, by which point in time you are maintaining depleted assets. Those groups that did not include capital maintenance at all argued that they felt uncomfortable making estimates without information. But ignoring something is the equivalent of estimating a value of zero, which is an estimate in itself. A few of you used the defense that I had asked you not to go out of the case, but you don’t have to, since your depreciation is the key indicator of how much maintenance cap ex you need. Also, you cannot keep depreciation in your cash flows (in perpetuity) and not have capital maintenance that matches the depreciation, since you will run out of assets to depreciate, sooner rather than later. The basis for capital maintenance estimates should always be depreciation and your book capital; tying capital maintenance to revenues or earnings can be dangerous. 5. Growth rates in perpetuity: The inflation rate was 3% and many of you used that as your growth rate. Some of you used a growth rate lower than that number, and that is perfectly okay, but the argument has nothing to do with real growth. If you had real growth in this project, your growth rate would actually be higher than 3% and would require a whole host of addintitional investment.
Finally, and this is a pet peeve of mine. So, just humor me. Please do not use the word "net income" when you really mean after-tax operating income. Not only is it not right, but it will create problems for you in valuation and corporate finance. Also, try to restrain your inner accountant when it comes to capital budgeting and don’t do full-fledged statements of cash flows. It hurts more than it helps. As a general rule, projects don't have balance sheets, retained earnings or cash balances. Also, if a project loses money, don't create deferred tax assets or loss carryforwards but use the losses to offset against earnings right now and move on. The grading for the case was out of 10, and there were 39 groups. For those of you who need to know where you stand relative to the rest of the class, here is what the distribution of final grades looked like:
If you have issues with my grading, please bring them up with me. In some cases, your cash flow calculations were opaque and I could not tell what you were doing in the background.
|
||||||||||||||||||
| 3/29/25 | I hope that you had a great break and have come back rested and ready to go. I know it seems like a lifetime ago, but a few reminders:
1. Quiz on April 7: Your second quiz will be on April 7 and it will cover the rest of packet 1 (not covered on the first quiz). It will be centered around investment analysis, and it is a good idea, if you have issued with the case, to get them resolved.
You can also find all past quizzes with the solutions in the following links:
As with the first quiz, I will have extra office hours on Sunday for any questions that you might have. The details on timing will come later this week. 2. Packet 2: We will be starting on packet 2 of the lecture notes on Monday. Please download them (or print them) before the class:
3. Newsletter: The newsletter for the week is attached. Attachments: Issue 8 (March 29) |
||||||||||||||||||
| 3/30/25 | In this, the first week back from spring break, we will start on the discussion of the trade off between debt and equity, and ways of optimizing that mix. This material will not be on quiz 2, but is a start for wha twill be covered in the third quiz. Please do remember to download the second packet for the class:
Since we are in the home stretch, I thought it time to bring up the final exam. If you have checked the syllabus, you will note that it is scheduled to be on May 12 from 11.15 pm = 1.15 pm. Many of you have reached out about the possibility of doing the final exam earlier, and I understand that you have to make travel plans around the final exam schedule. Getting a large enough room in the week of May5 is tricky and I am considering moving the final exam to an entirely online format (on Brightspace). There are pluses and minuses to doing so. The biggest plus is that you can take it from anywhere in the world, albeit in a different time zone, at the same time as the scheduled exam. That said, the exam, while preserving the format and structure of past final exams, will become a multiple choice exam, with the right answer being all or nothing. There are advantages and disadvantages from this. The first is that I will have to write the questions a little differently to make the answers more absolute, but that is a problem that I can overcome. The second is that since the right answer will be one of the multiple choice answers, you can save yourself time if you get the right answer. The biggest disadvantage is that I cannot give partial credit. Before I pull the trigger on this, I will get a feel for where you stand in class tomorrow with a show of hands, and make my final decision. |
||||||||||||||||||
| 3/31/25 | In today's class, we started our discussion of the financing question by drawing the line between debt and equity: fixed versus residual claims, no control versus control, and then used a life cycle view of a company to talk about how much it should borrow. We then started on the discussion of debt versus equity by looking at the pluses of debt (tax benefits, added discipline) and its minuses (expected bankruptcy costs, agency cost and loss of financial flexibility). Even with the general discussion, we were able to look at why firms in some countries borrow more than others, why having more stable earnings can make a difference in how much you can borrow and why having intangible assets can affect your borrowing capacity. |
||||||||||||||||||
| 4/2/25 | We started this class by looking at how the cost of capital can be used to optimize the right mix of debt and equity. In effect, you estimate the costs of debt and equity at different debt ratios, and try to find the mix of debt and equity that minimizes your cost of capital. If you want to try your hand at using the spreadsheet to optimize debt ratio, try the following:
|
||||||||||||||||||
| 4/3/25 | This week, you get to optimize capital structure for your company, and as I noted in class, it will also give you a chance to get caught up on stuff you should have been doing but have been putting off in class. The spreadsheet that you will use to figure out your company’s optimal debt ratio is:
I know that I have been sending you serial emails on the project over the whole semester and that some of you are way behind. Since it may be overwhelming to go back and review every email that I have sent out over time, I thought it would make sense to pull all the resources that I have referenced for the project into one page, which you can use as a launching pad for starting (or continuing) your work on the project.
1. Resource page: I put the link up to the corporate finance resource page, where I will collect the data, spreadsheets and webcasts that go with each section of the project in one place to save you some trouble:
http://pages.stern.nyu.edu/~adamodar/New_Home_Page/cfprojectresources.html 2. Main project page: I had mentioned the main page for the project at the very start of the class, but I am sure that it got lost in the mix. So, just to remind you, there is an entry page for the project which describes the project tasks and provides other links for the project: http://pages.stern.nyu.edu/~adamodar/New_Home_Page/cfproj.html I don’t now whether this will help or hurt, but I have created a to-do list for the project that is attached to this email.
3. Project formatting: I guess some of you must be starting on writing the project report or some sections thereof. While there is no specific formatting template that I will push you towards, I do have some general advice on formatting and what I would like to see in the reports:
http://pages.stern.nyu.edu/~adamodar/New_Home_Page/project/projform.htm It also has sample projects from prior years that you can browse through. If you look at the projects, you will see that the formats vary. Some use Word and one is in Powerpoint. They all emphasize comparative analysis and go beyond the numbers. So, be creative, put it in the format that best fits how you want to deliver your narrative and have fun with it. Note, in particular, to put muscle behind my plea for brevity. I have put a page limit of 20 pages on your entire written report (You can add appendices to this, but use discretion), if you have five companies or less. If you have more than five companies, you can add 2 pages for every additional company. |
||||||||||||||||||
| 4/4/25 | The in-practice webcast for the week is on using the spreadsheet, using Dell as my example. You can find the webcast and the related information below:
Webcast: https://youtu.be/RuaQvw5zHQQ
Dell optimal capital structure spreadsheet: http://www.stern.nyu.edu/~adamodar/pdfiles/cfovhds/webcasts/optdebt/dellcapstru.xls
You will notice that the Dell capital structure spreadsheet which is from a few years ago has a few minor tweaks that make it different from this year's version (which is attached), but it is fundamentally similar. In particular, take note of the fact that the spreadsheet will not work unless you have the iteration box checked under calculation options.
Just a reminder that I will have extra office hours on Sunday (April 6) from 4 pm - 6 pm. The zoom link is below:
|
||||||||||||||||||
| 4/5/25 | Hi,
At the start of the class, I promised you that just when you think that you have things nailed down, everything can change in a minute, and you could not have had a better example than last week. Now, you can see why the Chinese curse that you live in interesting times works. While I let Thursday's and Friday’s events rattle around in my brain, I did put together the latest newsletter for the class. I am sure that with the quiz around the corner, you won’t have a chance to look at it, but you can check it out after the break. Attachments: Issue 9 (April 5) |
||||||||||||||||||
| 4/6/25 | I hope that you are having a good Sunday (and I am not being sarcastic, even though I know that many of you are getting ready for the quiz). As quiz 2 approaches, here are some general thoughts:
1. Quiz 2 office hours: I will have office hours from 4 pm - 6 pm today. The zoom line is below:
2. Capital structure: This week, we will continue to work on capital structure, continuing after the quiz tomorrow with other approaches to optimizing financing mix and continuing to look at financing type on Wednesday. If you have not printed off or downloaded the second packet, please do so. |
||||||||||||||||||
| 4/7/25 | In today’s quiz-shortened class, we started by tying up loose ends on the cost of capital approach, starting with why moving to the optimal changes the value of a business (hint: it is all in the tax code) and then looking at how sensitive the optimal debt ratio is to changes in operating income or rating constraints. We also looked at enhancements to the approach, where we incorporated indirect bankruptcy costs in the analysis. We will continue looking at the optimal financing mix in the next session. |
||||||||||||||||||
| 4/8/25 | Your quizzes are done and can be picked up on the ninth floor of KMEC. It is on the top shelf of the table that is just in front of the door to enter the finance department. They are in alphabetical order, face down. So, please don’t mess them. As always, I am attaching the solution, and if you have any issues with the grading, take a picture of the page that you think I have short changed you, and I will fix your grade. The distribution is attached as well. Attachments: Quiz 1, solution and grade distribution |
||||||||||||||||||
| 4/9/25 | HI,
In case you are interested, I did put up a weekly puzzle for yesterday, but did not have the heart to draw the attention to it, since you were just picking up your quizzes. It is about how distortions in the tax code can drive decisions made by companies:
While the facts are dated and Pfizer never went through with its tax inversion plan, put yourself back in time and try to address the questions.
We started today’s class by first looking at the determinants of optimal debt rations and then how to optimize debt mix with the adjusted present value approach, where we begin with the unlevered firm value, and then add the tax benefits of debt and net out expected bankruptcy costs. While you can download the APV spreadsheet that I have online, I don’t really see a need to do the APV analysis of your company’s capital structure, since the expected bankruptcy cost is a black box. We then looked at peer group analysis, where companies decide how much to borrow by looking at what other companies in the sector do. You can check out the debt ratios for other companies in your sector by going to my website:
US industry averages: http://www.stern.nyu.edu/~adamodar/pc/datasets/dbtfund.xls
Global industry averages: http://www.stern.nyu.edu/~adamodar/pc/datasets/dbtfundGlobal.xls
I also mentioned market-wide regressions on the debt ratios of companies. You can find those at
|
||||||||||||||||||
| 4/10/25 | As we have a brief pause between the sefcond and the third quiz, it may be a good time to catch up on your project. If you read last Thursday’s longer missive, I suggested that you do the capital structure section of the project, and that process actually comes with a bonus. If you work on the capital structure spreadsheet, you will catch up with much of the earlier parts of the project, since you will also get the hurdle rate section for the project done. I am attaching the project to-do list that I had sent last week. Please look at the list and see if you can get some things checked off. Attachment: CF Project To-Do List |
||||||||||||||||||
| 4/11/25 | Hi,
The in-practice webcast for the week is on using the spreadsheet, , using Dell as my example. You can find the webcast and the related information below:
Webcast: https://youtu.be/RuaQvw5zHQQ
Dell optimal capital structure spreadsheet: http://www.stern.nyu.edu/~adamodar/pdfiles/cfovhds/webcasts/optdebt/dellcapstru.xls
You will notice that the Dell capital structure spreadsheet which is from a few years ago has a few minor tweaks that make it different from this year's version (which is attached), but it is fundamentally similar. In particular, take note of the fact that the spreadsheet will not work unless you have the iteration box checked under calculation options
Attachment: Capital Structure spreadsheet |
||||||||||||||||||
| 4/12/25 | I am attaching the newsletter for the week. As we approach the last few weeks of the semester, and you take stock of where you are in the class, there seems to some confusion about how your quiz scores, final exam score, the case and the project will play out in a numerical final grade. In particular, the question of what happens to the worst of your three quizzes, if you take all three, may be vexing some of you. I don’t know whether this will help but I have create a scoresheet where you can enter your actual scores for the first two quizzes and the case and prospective scores for the remaining quiz and final exam, and see the total score you will have in the class. At the moment, I cannot give you a look up table that will convert that total score into a letter grade, because that will depend on how the entire class performs on the remaining quiz, final and project. That said, the cut off for an A has varied from 89 to 91, and for a A- from 88 to 90, and for a B+ from 86 to 88, over the last ten years. Remember that the scores on this spreadsheet are not your scores, and as you enter your own scores, you will notice that the bulk of the class grade is still ahead of you, and that is good news for some of you and cautionary news for others. For those of you who have done badly on both of the first two quizzes, it is good news, since a good third quiz and final will rescue your total score. For those who have done really well on the first two quizzes, it is cautionary news, since letting your guard down too soon can still cost you. It also operates as a reminder of why getting your final project done is so critical. Just to give you perspective, the median score on the final project last year was 22/25, with a low of 16 (for one group) and a high of 25. If you are wondering what the 5 points for number submission is for, it is really for entering the numbers that you find on your company into the master spreadsheet by Sunday, May 4 (and it should be a gimme for almost all of you):
https://docs.google.com/spreadsheets/d/1xsASDBhkGo_1WhivAMLMkhi_z6cyYFnv1Q9G4y2TN4I/edit?usp=sharing
So, if you have been lagging on your project, you may want to catch up. Finally, there are two grading overrides, where you can get a score better than your score-based grade.
Staying on grades for just a moment more, please do check your scores on Brightspace to make sure that the scores match up to what you have on your records. With a large class, it is possible that grade entry can be wrong and grade changes not fully recorded. Attachments: Issue 10 (April 12) |
||||||||||||||||||
| 4/13/25 | I hope that you have a good weekend. In the week to come, we will complete our discussion of capital structure, which will be the focus of the third quiz. Since that quiz is a week from tomorrow, I thought I would send you the links to get you started, if you are so inclined:
Webcast link: https://www.youtube.com/watch?v=5UNYKC8rYiU
You can check out past quizzes and solutions at the links below:
Past quiz 3 solutions: http://www.stern.nyu.edu/~adamodar/pdfiles/cfexams/prqz3sol.xlsx
|
||||||||||||||||||
| 4/14/25 | intuitive and quantitative ways of debt design. In particular, we looked at a macro economic regression of firm value/operating income against interest rates, GDP, inflation and exchange rates. Keeping in mind the objective of matching debt to assets, think about the typical investments that your firm makes and try to design the right debt for the project. If your firm has multiple businesses, design the right kind of debt for each business. In making these judgments, you should try to think about
- whether you would use short term or long term debt - what currency your debt should be in - whether the debt should be fixed or floating rate debt - whether you should use straight or convertible debt - what special features you would add to your debt to insulate the company from default Your objective is to get the tax advantages without exposing yourself to default risk. If you want to carry this forward and do a quantitative analysis of your debt, you can try regressing enterprise value and operating income at your firm against macroeconomic variable. The spreadsheet below helps you do that:
It has annual and quarterly data through 2024. Just a warning that it is extremely noisy and may spit out output that does not make sense. It also contains the sector averages, broken down by SIC code. The post class test & solution for today is attached
|
||||||||||||||||||
| 4/15/25 | Hi,
In this week’s puzzle I decided to use AMC to illustrate not only the dangers of debt, but the difficulty with extracting yourself from a position of having too much debt. For those of you who do not know what AMC does, it the largest theater chain owner in the US and it has been buffeted by two major forces - the first is the slow motion disruption that streaming has brought to the entertainment business and the second is the devastation created by the COVED economic shut down. You can start with my post on the entertainment business;
I mention movie theatre businesses in that post, but to look at AMC’s journey over the last few years, you can start by looking at their financials:
You can take a look at the stock price, where the movements have been insane (and I use that word intentionally) as AMC became a meme stock and its CEO actively encouraged players to game the stock:
In April 2024, AMC is looking disaster in the face as its market cap has dropped to $500 million and with a debt load of $19 billion plus, the debt ratio is 96.28%. While it is clearly over levered, I ran the optimal capital structure spreadsheet to assess what it could afford:
AMC knows that it has too much debt, and it has tried a couple of moves:
Neither one has stuck, and the end game may be playing out. Here are my general questions for this week’s puzzle:
On an entirely different note, I think that there is still some confusion about due dates and exam schedules. To be clear, here are the dates:
April 21: Quiz 3 (10 points)
May 4: Numbers from final project entered on master spreadsheet by midnight (5 points)
May 5: Final Project due (by the end of the day) (25 points)
On the final exam (worth 30%), here are your choices. There will be an online exam on May 8, if you want to be done early. There will be an in-person and online exam on May 12, if you prefer that date.
May 8 9 am - 11 am online (I am sorry but I cannot offer a wide window)
May 12, 11.15 - 1.15: In-person (in Paulson Auditorium)
Online, from 11.15- 1.15 - if you choose to do it online
I will set up a Google spreadsheet for you to sign up for your preferred option, and if you tell me nothing, I will assume that you will be taking the exam in person in Paulson on May 12.
Hope that helps.
|
||||||||||||||||||
| 4/16/25 | debt mismatches (swaps or derivatives/ new project financing), before moving on to the dividend principle. We started with an assessment of what dividends would look like if they were truly residual cash flows before looking how they have evolved in practice - they are sticky, they follow earnings and the shift towards buybacks in recent decades, and how that shift can be explained by the increased desire for flexibility among companies that face more uncertainty about future earnings. We then moved on to two measures of dividend policy - dividend payout and yield, before looking at three schools of thought on dividends that cover the spectrum (dividends don’t matter, dividends are bad, dividends are good)., We ended the class by looking at two bad reasons for paying dividends (that they are more certain, that you had a good year). In the next class, we will talk about three good reasons for paying dividends as well as a way of measuring how much cash can be returned (FCFE). Of course, quiz 3 is also scheduled for Wednesday, and I wish you the best on that front. | ||||||||||||||||||
| 4/17/25 | On the project, the place to start your debt design is with intuition. In fact, if you have done a prior step in the project (where I asked you to describe a typical project for your company), you are well in place to complete your intuitive analysis. In my view, this is the more critical part of debt design (more important that the quantitative analysis that I will describe in the rest of this email). If you plan to do a quantitative analysis of your debt. I have attached the spreadsheet that has the macroeconomic data on interest rates, inflation, GDP growth and the weighted dollar from 1986 to the present (I updated it to include 2022 data. The best place to find the macro economic data, if you want to do it yourself, is to go to the Federal Reserve site in St. Louis:
Give it a shot and download the FRED app on your iPad and iPhone. You can dazzle (or bore) your acquaintances with financial trivia. You can enter the data for your firm and the spreadsheet will compute the regression coefficients against each. You can use annual data (if your firm has been around 5 years or more). If it has been listed a shorter period, you may need to use quarterly data on your firm. The data you will need on your firm are:
- Operating income each period (this is the EBIT)
- Firm or Enterprise value each period (Market value of equity + Total or Net Debt); you can use book value of debt because it will be difficult to estimate market value of debt for each period. You can also enterprise value (which is market value of equity + net debt), if you are so inclined. I know that you should be including the present value of lease commitments each period, but that would require doing it each year for the last ten. One way to get this data is to use the FA function in Bloomberg or from S&P Capital IQ.
I have to warn you in advance that these regressions are exceedingly noisy and the spreadsheet also includes bottom-up estimates by industry. There is one catch. When I constructed this spreadsheet, I was able to get the data broken down by SIC codes. SIC codes are four digit numbers, which correspond to different industries. The spreadsheet lists the industries that go with the SIC code, but it is a grind finding your business or businesses. You can check this list out though it is not exactly user friendly.
My suggestion on this spreadsheet. I think it should come in low on your priority list. In fact, focus on the intuitive analysis primarily and use this spreadsheet only if you have to the time and the inclination. My webcast for tomorrow will go through how best to use the spreadsheet.
Webcast link: https://www.youtube.com/watch?v=5UNYKC8rYiU
You can check out past quizzes and solutions at the links below:
Past quiz 3 solutions: http://www.stern.nyu.edu/~adamodar/pdfiles/cfexams/prqz3sol.xlsx
I will also have office hours on Sunday from 4 pm - 6 pm, and the zoom link is below:
|
||||||||||||||||||
| 4/18/25 | I have put up the webcast up on debt design, using Walmart as my example (on the webcast page as well as on the project resource page). Here are the details on the webcast:
Webcast: https://youtu.be/ozpSk80ZNC0
Presentation: http://www.stern.nyu.edu/~adamodar/pdfiles/cfovhds/webcasts/debtdesign/debtdesign.ppt
WMT financial summary: http://www.stern.nyu.edu/~adamodar/pdfiles/cfovhds/webcasts/debtdesign/WMTFAsummary.pdf WMT macrodur.xls spreadsheet: http://www.stern.nyu.edu/~adamodar/pdfiles/cfovhds/webcasts/debtdesign/WMTmacrodur.xls The updated macroduration spreadsheet with data through 2023 was linked to in Wednesday's email! Hope you find it useful.
One final point. If you find this in-practice webcast useful and want to review the whole series, the playlist is on YouTube and you can find it at this link:
|
||||||||||||||||||
| 4/19/25 | I hope that you are doing well. I won’t ask you what your weekend plans are going to be, because that may evoke obscenities directed at me. If you do feel the urge to pull yourself away from working on quiz 3, I have attached the eleventh newsletter for the class, to add to the ten others that are buried in emails from weeks past. The good news is that the end is near and there is only one more left. Attachments: Issue 11 (April 19) |
||||||||||||||||||
| 4/20/25 | I hope that you have had a good weekend and that you were able to spend some time with family. In hindsight, I wish that I had checked the calendar more carefully before scheduling this quiz, since this was the weekend for both Passover and Easter, and I am sorry for causing distortions in your schedule. For those of you who are still at home, and would like to spend more time there, I do have an option that you can use. The third quiz is online on Brightspace, and it will be available at the same time as the class takes it. If you are able to take the quiz in person, I would still like to see you in class, but if you cannot, please use the online version. | ||||||||||||||||||
| 4/21/25 | We started today’s class with the third and final quiz of the class, before moving on to the dividend principle. We started by looking at three schools of thought on dividends that cover the spectrum (dividends don’t matter, dividends are bad, dividends are good)., We ended the class by looking at two bad reasons for paying dividends (that they are more certain, that you had a good year), and with one good reason - a clientele that likes dividends. We will continue with more good reasons in the next session, before introducing a measure of how much companies can afford to return in the form of a free cashflow to equity. |
||||||||||||||||||
| 4/21/25 | Your quizzes are ready to be picked up, if you did them physically, or downloaded, if you did them online. The physical exams are in the usual spot (ninth floor, KMEC) and are in alphabetical order, in two piles. Please pick up your quiz and leave the pile in the same order. I have attached the solution, with the grading template, as well as the grading distribution. At this stage, the individual quiz scores matter less than your cumulative distribution, and you can update the grade calculator spreadsheet that I sent you before (that I am reattaching). As always, if I have screwed up, bring it to my attention and I will fix the error. |
||||||||||||||||||
| 4/22/25 | A couple of weeks ago, I sent you a to-do list for the project as a word document, but it looks like a large percentage of you have not opened that document (I can tell… Creepy, I know… But I can). So, I decided to put that to-do list on an email, just in case this may have a better chance of being read. So, here is what needs to get done on the project, starting from the beginning of the class. (I know the list looks daunting, but work you do on one section will help you on others… So, just get started…
1. Corporate Governance: in the corporate governance section, your objective is to assess where the power lies in your company, with managers, insider shareholders, the government (sometimes) all seeking to extract the power that shareholders have, on paper, to call the shots.
1.1: Start with an assessment of the top management of the company, with their tenure and history playing into your analysis.
1.2: Take a look a the board of directors, in terms of composition, background and tenure, but look for any signs that the board has acted as a check on management. Then make your assessment of how much power shareholders have in this company (from no power to some power to significant power).
1.3. Examine the top shareholders in the company to evaluate whether they are more passive or activist, with most institutional investors falling into the former.
2. Risk: In the risk section, you are attempting to use the company’s history to form a judgment on how risky it is as a company, and to estimate a hurdle rate for the company.
2.1: Us the company’s stock price history, relative to he market, in a regression to estimate the beta, alpha and R-squered for your company (you will need the Bloomberg beta page for it)
2.2: Estimate a bottom up beta, based upon the business or businesses that your firm operates in, and an equity risk premium, based on where it operates.
2.3: Find your company’s bond rating, if it has one, or estimate a synthetic rating for your firm, and use that rating to find the default spread and cost of debt for your firm
2.4: In your chosen currency, estimate costs of equity and capital for your firm.
3. Project Characteristics and Returns: in this section, you are looking at the structure of a typical project or projects for you firm, and making judgments, based upon company-wide data on whether these projects have been value creating or destroying.
3.1: Lay out the characteristics (duration, cash flow patterns, currency mix, etc.) of a typical project or projects for the firm, in generic terms (you cannot get the number detail, without working at the firm).
3.2: Compute the accounting return on equity and invested capital for your firm. (If you have negative book equity, the former will be nor meaningful, but you should still compute a return on capital). The numbers can sometimes be negative or absurdly high, and you have to find the signals in the noise. If you need some help, I do have a spreadsheet that helps you compute accounting returns.
3.3: Tie your accounting returns to your competitive advantages or barriers to entry (or lack thereof) and talk about changes you see coming to the business. This is your chance to talk about industry trends and competitive forces.
4. Optimal capital structure: You need to compute the optimal debt ratio for your company
4.1: Estimate the cost of capital at different debt ratios.
4.2: If you want to augment the analysis by using the APV approach (apv.xls), do so. Clearly, these approaches will add value only if you have a sense of how operating income will change as the ratings change for your company or the bankruptcy cost as a percent of firm value.
4.3: Assess how your firm's debt ratio compares to the sector. You can just compare the debt ratio for your firm to the average for the sector. If you feel up to it, you can try running a regression of debt ratios of firms in your sector against the fundamentals that drive debt ratio (Look at the entertainment sector regression I ran for Disney in the notes).
5. Debt design: As you work your way through or towards the debt design part, here are a few sundry thoughts to take away for the analysis:
5.1. The heart of debt design should be the intuitive analysis, where you look at what a typical project/investment is for your firm (perhaps in each business it is in) and design the most flexible debt you can, given the risk exposure.
5.2. The quantitative tools (the regression of firm value/ operating income versus macro variables) may or may not yield useful data. The bottom-up approach (using sector averages) offer more promise. If you have a non-US company, a US company with little history or get strange results, stick with just the intuitive approach. Use the spreadsheet at this link to do both:
Try it, but if your numbers look weird, just stick with the intuitive analysis and move on.
5.3: Compare the actual debt to your perfect debt (either from the intuitive approach or from the quantitative approach) and make a judgment on what your company should do.
6. Dividend analysis: We developed a framework for analyzing whether your company pays out too much or too little in dividends in class yesterday. You can read ahead to chapter 11, if you want, and use the spreadsheet at the link below to examine your company.
6.1: Examine whether your company has returned cash to its stockholders over the last few years (5-10 or whatever time your firm has been in existence) and if yes, in what form (dividends or stock buybacks). The information should be in your statement of cash flows.
You can watch the webcast I will be posting tomorrow, if you run into questions.
6.2: Make a judgment on whether your company should return more or less cash to its stockholders. In particular, estimate
- the potential dividends (FCFE) that your company has generated in the past
- the quality of projects that your company faces (perhaps by returning to section 3 for the excess returns)
- the debt capacity of your company - i.e., is it under or over levered (section 4)
The next section has not been covered yet in class, but you can get a jump on it now, if you want.
7. Valuation: This is a corporate finance class, with valuation at the tail end. We will look at the basics of valuation next week and you will be valuing your company. Since we will not have done much on valuation, I will cut you some slack on the valuation. It provides a capstone to your project but I promise not to look to deeply into it. Knowing how nervous some of you are about doing a valuation, I have a process to ease the valuation: Download the fspreadsheet on my website. It is a one-spreadsheet-does-all and does everything but your laundry.
You will notice that the spreadsheet has some default assumptions built in (to prevent you from creating inconsistent assumptions). I let you change the defaults and feel free to do so, if you feel comfortable with the valuation process. If not, my suggestion is that you leave the inputs alone. You will notice that I ask you for a cost of capital in the input page. Since you already should have this number (see the output in the optimal capital structure on section 1), you can enter it. If you want to start from scratch, there is a cost of capital worksheet embedded in the valuation spreadsheet. There is a diagnostic section that points to some inputs that may be getting you into trouble. I also ask you for information on options outstanding to employees/managers. That information is usually available for US companies in the 10K. If you cannot find it, your company may not have an option issue. Move on. The industry averages for most inputs and the latest equity risk premiums are already in this spreadsheet. If you find yourself stuck or just want to watch a bad homemade movie, try this YouTube guide that I have to using the spreadsheet:
Hope it helps.
8. Google shared spreadsheet: As you get the numbers for your company, please enter them into the shared spreadsheet. In fact, to provide some inducement to do this, I will assign 5 points out of the 30 points on the final project to getting your numbers into the spreadsheet.
https://docs.google.com/spreadsheets/d/1xsASDBhkGo_1WhivAMLMkhi_z6cyYFnv1Q9G4y2TN4I/edit?usp=sharing
Please, please do this by Sunday, May 4, since I will need the numbers for the final session. Having the numbers in this master list will be 5% of the 30% on the project, just as an inducement.
9. Project write-up and formatting: If you are thinking of the write-up for the project and formatting choices, you can look at some past group reports on the site for the class under final project.
I prefer brevity and I want to emphasize the page limit of 20 pages on the project, if you have five or fewer companies, with appendices if needed, and two extra pages for each extra company in your group (if you have seven companies, your page limit becomes 24 pages..). As a general rule, steer away from explaining mechanics - how you unlevered or levered betas -and spend more time analyzing your output (why should your company have a high beta? And what do you make of their really high or low return on capital?). I am not looking for a collection of numbers and equations but a narrative about your company that ties together what you have learned as you navigated the parts.
Ah, where is the good news? You will be done with the project exactly 13 days from today. It is due by 5 pm on May 5. |
||||||||||||||||||
| 4/23/25 | I am in the process of moving offices, to accommodate construction and I am trying to lighten my load. I have quite a few copies of the third edition of my Investment Valuation book (albeit the third edition) and a few copies of Applied Corporate Finance, up for grabs. I also have Korean, Chinese, Polish and even Russian editions of my books for anyone who wants them. (Since I cannot read any of these languages, I am afraid that I cannot attest to whether the translations are accurate). So, if you want to come by my office today (until 10.15, 12-1.15 and from 5 pm - 5.30 pm), you are welcome to whatever you want. | ||||||||||||||||||
| 4/23/25 | In today’s session, we started by looking at some bad reasons for paying dividends and a couple of good ones, including having an investor base that likes dividends, one iffy reason (dividends as a signal) and one borderline reason (that you can rip of lenders). We then looked at three questions that need to be asked in assessing dividend policy, starting with how much a company can afford to return to stockholders (FCFE), then looking at how much is actually returned in dividends and buybacks and finally assessing whether you trust management enough to give them the freedom to set dividend policy. We put this framework into practice by asking and answering these questions with the companies that we are examining in this class. |
||||||||||||||||||
| 4/24/25 | I promised you that I would nag you every day until May 5, and I plan to keep my promise. Please revisit the to-do list that I sent you by email just a couple of days ago, and if you are behind, don’t panic. Work through the list incrementally, This week’s task is dividends, and it is one of the easier parts of the project, in terms of the number crunching. I have already put up the in-practice videos on the webcast page for the class:
Please watch the videos, if you feel directionless. For those of you who want to get a jump on the final exam, I have also put up the final exam review session and the links to past finals. (Please remember that if the links don’t work, it is a browser problem).
Review session: https://youtu.be/XOCfyjEdg-k
Review session slides: http://www.stern.nyu.edu/~adamodar/pdfiles/cfexams/reviewFinalNew.pdf
You can try past final exams and check the solutions here:
Past final solutions: http://www.stern.nyu.edu/~adamodar/pdfiles/cfexams/cffinals.xlsx
On the past final exams, you will notice that I have shifted from five to six multi-part problems to ten stand-alone problems. It reduces the risks that mistakes you make on one part carry over into the other ones. I have decided to stick with this format for this year’s final exam as well, and against the multiple choice format that I was considering earlier. It is not fair to not be able to earn partial credit. |
||||||||||||||||||
| 4/25/25 | As we work through the analysis of dividend policy, you have to look at the trade off on traditional dividends (and whether your company is a good candidate for paying dividends or increasing them). You have to follow up by assessing potential dividends and whether your company is returning more, less or just about the same amount as that potential dividends.
The first webcast looks at the trade off on dividends
Presentation: http://www.stern.nyu.edu/~adamodar/pdfiles/cfovhds/webcasts/dividends/dividendtradeoff.pdf
The second webcast looks at the question, again using Intel:
Presentation:http://www.stern.nyu.edu/~adamodar/pdfiles/cfovhds/webcasts/dividends/dividendassessment.pdf
Spreadsheet: http://www.stern.nyu.edu/~adamodar/pdfiles/cfovhds/webcasts/dividends/IntelDividends.xls
Annual Report: http://www.stern.nyu.edu/~adamodar/pdfiles/cfovhds/webcasts/dividends/IntelAnnualReport.pdf
Historical data: http://www.stern.nyu.edu/~adamodar/pdfiles/cfovhds/webcasts/dividends/IntelBloomberg.pdf
The spreadsheet that goes with these webcasts is an old one. So, use the updated version that I sent you yesterday which has data through 2023:
I hope you get a chance to take a look at the webcast.
|
||||||||||||||||||
| 4/26/25 | The good news is that this is the last newsletter. The bad news is that this means the end is near. If you are working on your project this weekend, I hope that it is a productive one and at the risk of reminding you one times too many, please enter your numbers in the Google shared spreadsheet, when you have a chance.
https://docs.google.com/spreadsheets/d/1xsASDBhkGo_1WhivAMLMkhi_z6cyYFnv1Q9G4y2TN4I/edit?usp=sharing
Looking to the final exam, I know it is early, but here are a few reminders. The final exam will be on May 12 from 11.15 am -1.15 pm. It is cumulative and will be open book, open notes. If you are ready to start reviewing past finals:
Review session: https://youtu.be/XOCfyjEdg-k
Review session slides: http://www.stern.nyu.edu/~adamodar/pdfiles/cfexams/reviewFinalNew.pdf
You can try past final exams and check the solutions here:
Past final solutions: http://www.stern.nyu.edu/~adamodar/pdfiles/cfexams/cffinals.xlsx
Two other notes. There will be an online variant either on May 8 from 3.30 pm - 5.30 pm or on May 12 at the same time (11.15 am - 1.15 pm) as the regular exam, for those who will have left New York before the final exams week. Please go into the google shared spreadsheet, and let me know your choices:
https://docs.google.com/spreadsheets/d/1L4lZjDgtNna6tlc8TWa6nWojyEJZIdkZLy4gx3E3tu4/edit?usp=sharing
If you are in New York on May 12 and have special reasons for not being able to take the exam in person, please reach out to me. Finally, if you do get a chance, please check the quiz and case grades that you have on Brightspace to make sure that they match up with what you have. Attachments: Issue 12 (April 26) |
||||||||||||||||||
| 4/27/25 | This week, we will approach closure on the class, finishing the dividend section tomorrow and starting valuation right after. In parallel, I hope that you will be tying up loose ends on your project. Will see you in class tomorrow! | ||||||||||||||||||
| 4/28/25 | In today's class, we started by using the dividend assessment process of looking at FCFE/cash return and then gauging trust in management, using the companies that we have used as lab experiments in the class (Vale in 2013, Tata Motors in 2013) and peer group analysis. In the process, we looked at why it is so difficult to get out of a dysfunctional dividend policy, as control trumps sanity and worries about the short term and peer group comparable delay action. We then started on valuation as the place where all of the pieces of corporate finance come together - the end game for your investment, financing and dividend decisions. We then looked at how these numbers can be different depending on whether you take an equity or firm perspective to valuation and what causes these numbers to change. Ultimately, though, the best way to learn valuation is by playing with the numbers and seeing how value changes. Finally, I have a spreadsheet that is versatile enough to cover every company in this class. Please use it for your valuation:
If you need some guidance on using this spreadsheet, try this YouTube video that I put together for the Motley Fool early last year:
I am sorry but I was a little hoarse when I did this, but I think I made it through to the end. Many of the inputs that you need for this spreadsheet should have already have been estimated or looked up for other parts of the project. Also, as you enter the key numbers for revenue growth, target operating margin and sales/invested capital, think of the story that drives these numbers. I know that you may find this to be a bit of a black box at the moment, but given that time is of the essence, I thought it would not make sense for you to be building up your excel skills at the moment. |
||||||||||||||||||
| 4/29/25 | As your project winds down (or up), I am sure that there are loose ends from earlier sections that may bother you, I have listed a few of the questions that seem to be showing up repeatedly in emails:
1a. Do I need to update my accounting numbers to reflect first quarter earnings reports?
The answer is complicated. I would like them to be, and it is easy to do, if you have kept your input numbers in a separate sheet. If you have hard coded numbers into spreadsheet, it will be really messy, and my advice is don’t do it. Pick a date for your macro numbers (risk free rate, equity risk premium etc.) and do your analysis as of that date. Move on!
1b. I just discovered that my company lists revenues from "other businesses". How should I treat these in bottom-up beta computations?
If your company tells you what the other businesses are, you can try to incorporate their betas into your bottom up beta. If all you have is a nebulous 'other businesses', I would ignore it in beta computations.
1c. I just discovered that my US company has revenues from other countries (including emerging markets) and in other currencies. How does this affect my cost of equity/debt/capital?
First, if you have chosen to do your analysis in a currency (say US dollars), your riskfree rate will be the riskfree rate in that currency (US treasury bond rate), even if the company has revenues in multiple currencies. Second, your cost of debt will still be that of a domestic company. Coca Cola will not have to pay an Indian country default spread when it borrows money in rupees. If it had to, it would just borrow in the US and use currency derivatives to manage risk. Third, and this is the only place it may make a difference, it may change the equity risk premium you use. Instead of using the mature market premium, you may decide to incorporate the additional risk of some of the countries that you operate in. Note that this is likely only if you know your revenue exposure in some detail and you get significant revenues from emerging market countries (with less than AAA ratings).
1d. What should I be doing with the cash balance that my company has when computing the unlevered beta?
Adjusting betas for cash creates more headaches and confusion than perhaps any other aspect of discount rates. Back up, though. To get the unlevered betas of the businesses that your company is in, you should always start with the average regression beta for the companies in the sector, unlever the betas using the average gross D/E ratio and then adjust for the average cash balance at these companies. (That will yield the unlevered betas corrected for cash for each of the businesses that your company is in).
Now, comes the tricky part. You can compute an unlevered beta for just the operating businesses that your company is in, by taking the weighted average of the unlevered betas of the businesses. You can also compute an unlevered beta for the entire company, with cash treated as an asset/business with a beta of zero. The latter will always be lower than the former. My suggestion is that you compute both.
If you are now computing a cost of equity as an input into the cost of capital, you want to use the unlevered beta of just the operating assets of the business as your starting point for levered beta and cost of equity. That is because the cost of capital is a discount rate that we apply to operating cash flows (and to value the operating assets). In fact, we add the current cash balance to this value, because cash has been kept separated from operating assets. (If you use the lower unlevered beta that you get with cash incorporated into the calculations to get to a cost of capital, you will end up at least partially double counting cash, once by lowering the beta and the cost of capital, and again when you add cash at the end).
When would you use the beta for the company (with the cash beta of zero incorporated into your calculation)? Rarely. Here is one scenario. Let's assume that you are looking at a discounting the dividends of a company or an overall cash flow that is estimated from net income. These cash flows reflect cash flows from all of the company's assets (not just its operating assets) and it is appropriate to use the lower company beta with the cash effect built in.
(If you find this too abstract, go back to lecture note packet 1 and check out pages 180 & 181, where I estimated Disney's beta and cost of capital)
2. My company already reports leases as debt. Should I capitalize leases?
No. You don’t have to, if you generally trust accountants. If you don’t, you can use the capitalization spreadsheet (assuming you have commitments for the future) and do it yourself, but don’t double count.
3. I have a negative book value of equity. How do I compute ROE and ROC?
First the book equity you should use for ROE and ROC should be the total shareholders equity, which can be a negative number. With a negative book value of equity, you cannot compute ROE. You should still be able to compute return on capital, since adding the book value of debt to negative book equity should still lead to a positive book capital. If book capital is negative, though, you cannot estimate return on capital either.
3a. I am getting absurdly high values for return on invested capital for my company. What do I do?
A return on invested capital is ultimately an accounting number, and accounting inconsistencies (about what expenses get capitalized and what expenses does) and choices (about write offs) can create havoc on the number. Rather than try to finesse the number to make it look palatable, just report the number, absurdly high though it is, qualify that when you discuss the quality of the company’s projects, and hold on to the memory to use on someone who acts like the ROIC is a magic bullet, the answer to every question.
4. My ROE > Cost of equity and my ROC < Cost of capital (or vice versa). How is this possible and how do I explain it?
There are two reasons why the two measures may yield different conclusions:
1. The net income includes income/losses from non-operating assets including cross holdings in other companies. If you have cross holdings that are making you a lot of money, you can end up with a high ROE, even though ROC looks anemic. If you have cross holdings that are losing you money, the reverse can happen. Net income is also affected by other charges (restructuring, impairment etc.) and other income... I trust the ROC measure more when it comes to answering the question of whether the company takes good investments.
2. The ROE reflects the actual interest expense on debt. To the extent that you are borrowing money at rates lower than what you should be paying (given your default risk and pre-tax cost of debt), you are exploiting lenders and making equity investors better off. Thus, you can take bad projects with "cheap" debt and emerge successful as an equity investor. (Think of the LBOs done earlier this year.)
5. My Jensen's alpha is positive (negative) and my excess return is negative (positive). How do I reconcile these findings?
Market prices are based on expectations of how well or badly you will do in the future. To the extent that you beat or fail to meet these expectations, stock prices will rise or fall. Thus, if you are a company that is expected to earn a 30% ROC and you earn a 25% ROC, you will see your stock price go down (negative Jensen's alpha) even though you have a healthy positive EVA. Conversely, if you are a company that is expected to make only a 2% ROC and you make a 3% ROC, you will see your stock price go up (positive Jensen's alpha) while your EVA will be negative.
6. How do I come up with the cash flows and characteristics of a typical project?
I really do not expect you to come up with cash flows. Just describe in very general, intuitive terms what a typical project will look like for your company. For Boeing, for instance, you would describe a typical project in the aerospace business as being very long term, with a long initial period of negative cash flows (when you do R&D and set up manufacturing facilities) followed by an extended period of positive cash flows in multiple currencies.
7a. My optimal debt ratio is coming out to be zero. What am I doing wrong? The most common input error that can lead to an optimal debt ratio of zero is that you mismatched units (it is usually the share count that is in different units than the rest of your numbers). If there are no input errors, it is entirely possible that your optimal debt ratio is really zero. That can happen in three scenarios. The first is if your operating income is a low percentage of your enterprise value; for high growth firms, the market cap can be high relative to operating income, because of growth potential being priced in. Zoom, for instance, is a vibrant, fast growing company but its optimal debt ratio is zero percent. The second is if you have a very low unlevered beta, which can happen either because you are in a very safe business or because you are using a regression beta that does not reflect your current debt to equity ratio.
7b. The cost of capital is higher at my optimal debt ratio than at my current debt ratio. Why does that happen and what do I do?
Try the "FAQ" worksheet in the capital structure spreadsheet. In general, though, the differences come from the fact that the cost of capital is derived on the assumption that the rating at each debt ratio will match the synthetic rating, and that your interest expense will be the long term cost of debt at the debt level multiplied by the dollar debt. Your computed cost of capital is based usually on an actual rating (which may be higher or lower than the synthetic rating) and your actual interest expenses may include old or short term debt, with an interest rate that is very different from the long term rate at that debt level. (You can at least partially fix both problems by answering yes to the last two questions on the input page, but only partially…)
8. If my firm is already at its optimal debt ratio, do I still need to go through the debt design part?
Yes. You still have to determine whether the debt the company already has on it's books is of the right type. The only scenario where you can skip this is if both your actual and optimal debt ratios are zero percent.
9. I cannot do the macro regression (because my company has been listed only a short period or is non-US company). What do I do about debt design?
Skip the macro regression. You can still use the bottom up estimates for the sector in which your firm operates. To do this, you need an SIC code which your non-US company will not have. Look up a US competitor to your company and look up its SIC code. You can also still do the intuitive debt design. (I would do the same if you are getting absurd or meaningless results from your macro regression...)
10. My macro regression is giving me strange look output. What should I do?
Take a deep breath. The macro regression is run with 10 or 11 observations and you can get "weird" output because of outliers. That is why you should look at the bottom up estimates and bring in your views on what a typical project for a company looks like.
11. My company pays no dividends. Should I bother with dividend analysis section?
Yes. Paying no dividends is a dividend policy. You will have to estimate the FCFE to check to see if this policy makes sense. (If the FCFE <0, it does...)
12. I have a non-US company. How do I get market returns and riskfree rates for the dividend analysis section?
On this one, I am afraid that the fault is mine for not giving you a way to pull up the data on other markets. To compensate, I will be okay with you using the US data for non-US companies.
13. I am getting strange looking FCFE for my company... What's going on?
Check the signs of the numbers you are inputting into the spreadsheet. If you are entering cap ex as a negative number, for instance, I will flip the sign around and add cap ex instead of subtracting it out...
14. My value is very different from the price. What's wrong?
First, very different is in the eye of the beholder. i have valued companies and obtained values that are less than one fifth of the price and five times more than the price. The reason is sometimes in my inputs but it can also be a massively under or over priced stock. So. check your numbers and if you feel comfortable with them, let it go.
15. What do I have to do, when I feel comfortable with the numbers that I have?
Please enter the numbers you have for your company in the Google shared spreadsheet:
https://docs.google.com/spreadsheets/d/1xsASDBhkGo_1WhivAMLMkhi_z6cyYFnv1Q9G4y2TN4I/edit?usp=sharing
When you are entering the numbers, please follow the number format that I have used for Disney. For instance, for R squared, I list 73%, not 0.73 or 73, and if you can also enter your R squared the way I did, it would make my work on Sunday a lot easier, if you follow my formatting, since this Google shared spreadsheet becomes the raw data with which I work. When you input your numbers, try not to add symbols to the numbers or comments.You can do that in your final report. This is purely a data report. Please get the numbers to me by midnight or earlier on May 4.
16. What should the final project report look like?
Please turn in one report for the whole group and save it as a pdf file (less chance of bad things happening to formatting than with Word or Powerpoint files). As you do this, remember the page limit (20 pages for a five-company group, with 3 extra pages for every additional company) On the front page, please list all group members in alphabetical order (last name). Please do not attach or include any excel spreadsheets. In addition, make sure that you list all the group members alphabetically on the first page and use “The Torture Ends” in the subject line.
17. When will this torture end?
Six days from today (5 pm on May 5)… But who’s counting? |
||||||||||||||||||
| 4/30/25 | In today's session, we continued on the question of how best to value a company by first looking at the drivers of value, with a special focus on terminal value.We argued that the same discount rates that we computed for investment hurdle rates can be used in valuation, with the caveat that these discount rates will change over time, as a company changes. While you can adjust betas, costs of debt and debt ratios, a simpler way to target a cost of capital in stable growth is to look at the median cost of capital for companies, in this graph.
These numbers are from January 2025 . The median cost of capital for a global company now is about 9.1%, in US dollar terms. With growth, the key is recognition that growth comes from what companies do in terms on how much they reinvest and how well, rather than from outside sources. Finally, for terminal value, I argued that the growth rate in perpetuity has to be less than or equal to the risk free rate. Since you will be valuing companies in different stages in the life cycle, I would like you to use the spreadsheet linked below:
As you can see, the valuation is built around revenue growth, operating margins and sales to capital ratios, all variables we spent time talking about in class today. I know that you feel uncomfortable with the valuation part, as it is towards the end of this class and requires story telling, but do the best you can. |
||||||||||||||||||
| 5/1/25 | By now, I have exhausted everything I had wanted to say about the project. I hope that your project numbers are getting nailed down. From the looks of the Google shared spreadsheet, we are taxiing towards takeoff and I thank you. I don’t plan to download the numbers (to prepare for the last class) until Sunday. Please enter your numbers, if you have not already, by then. If you have entered the numbers and change your mind, you can go in and change your numbers before then.
https://docs.google.com/spreadsheets/d/1xsASDBhkGo_1WhivAMLMkhi_z6cyYFnv1Q9G4y2TN4I/edit?usp=sharing
The report itself is due on Monday, and just to clarify, here are the logistics of report submission:
1. Due time: By 5 pm on Monday (May 5)
2. Format: Please convert your report into a pdf file. (No excel attachments or addendums)
3. Cover page: On the cover page, list all of the team members in alphabetical order
4. Page constraints: Please try to restrain yourself and stay within or very close to the page constraints (20 pages for the report of up to five companies, 3 extra pages for each additional company). I relaxed my constraints because some of you did note that it was tough to make it in fewer pages).
5. Submission form: Please send your report by email, with “The Torture Ends” in the subject
As you work on the final pieces of the project (dividends and valuation), cut yourself some slack. This is a process that requires both sides of your brain (left and right) stay engaged, and it can be exhausting as well as stressful. One constant question that you may have, as you do your analysis, is “how do I know this is right?”. All you can do is use the information you have, make your best judgments about the company, develop your story for your company and then let the chips fall where they might. While I will contest you, when I think your story has internal inconsistencies, I am very accepting of stories that diverge from my own. None of us has a monopoly on the truth. If you have questions about mechanics or sanity checks, Please try to use my valuation spreadsheet, since you will allow you to focus on your company’s story and inputs:
Finally, I will be in my office (KMEC 9-69) from 2 pm - 4 pm tomorrow, for any questions you have about the project, since it is more efficient to ask and get your questions answered in person. I also have a zoom link if you are not going to be able to make it in person, and still have questions:
On a different note, when you get a chance, please do go into the google shared spreadsheets, where you let me know when (and in what form) you plan to take the final exam:
|
||||||||||||||||||
| 5/3/25 | I know that you are working on the project, and I will not intrude too much. If you find yourself stuck on something, rather than belabor the point, please email me and I may be able to save you some time. You still have more than a day, but I am glad to see that the numbers are filling up. I will pull the numbers from the sheet late night on Sunday, to put together my presentation for Monday's class. I hope to see you there, in person! Thank you! | ||||||||||||||||||
| 5/3/25 | Sorry again for bugging you on a busy weekend, but as you know there is a google shared spreadsheet, where you make your final exam choices:
https://docs.google.com/spreadsheets/d/1L4lZjDgtNna6tlc8TWa6nWojyEJZIdkZLy4gx3E3tu4/edit?usp=sharing
Some of you have entered your choices already, and this is what I have right now:
If you are in the 94 who have made no choice, or among those who chose online but did not specify location, please make your choice as soon as you can, since a whole host of other logistical choices await me, after I get to know this breakdown.
|
||||||||||||||||||
| 5/4/25 | I am glad to see the masterlist filling up:
https://docs.google.com/spreadsheets/d/1xsASDBhkGo_1WhivAMLMkhi_z6cyYFnv1Q9G4y2TN4I/edit?usp=sharing
As it is populated, I thought I would take this moment before I descend into a time crunch on what I will be doing on my end:
1. For the moment, I am chilling, trying to answer last minute questions about the project numbers, getting my last eats in of New York bagels and cleaning my apartment.
2. At about midnight: I will take the numbers from the masterlist and download them into a spreadsheet, where I will compute the distributional statistics on what you have reported for your companies, from the Jensen’s alpah/R-squared numbers to accounting returns on capital/equity to whether your company is under or over levered to whether it pays out more or less than it can and capping off with value.
3. Those summary statistics will go into a powerpoint presentation that I am putting together for tomorrow, and I hope get a link to the presentation to you by 9.30 am tomorrow, an hour ahead of class. So, please check your email before coming to class.
4. The class will be a review of the entire semester, with your numbers operating as anchors. I know that some of you have been using the convenience of zoom sessions to take classes online, and I am okay with that. For tomorrow’s class, though, I would really, really like to see you in class, in person, if you can make it.
That’s its for the moment and I will see you in class tomorrow. |
||||||||||||||||||
| 5/5/25 | Slides are done and are attached. Looking forward to seeing you in person in class! Attachment: Closing Presentation |
||||||||||||||||||
| 5/6/25 | I am working my way through the projects, and hope to be done soon. While you wait for the project (or have already received it), your thoughts are probably turning to the final exam. Here are the details:
When: On Monday, May 12 from 11.15 am - 1.15 pm, in Paulson Auditorium (where we have our class). There are two online options, one for May 8, from 3.30 pm - 5.30 pm and one for May 12, from 11.15 am -1.15 pm, for those who choose that option. As I did mention in class and on other emails, I would prefer that you take the exam in person, if you can, but if you cannot, the online option is available. (Please do not treat this as an option, where you take in online on May 8, and if you do badly, take it again on May 12).
How: For the physical exam, the answer is obvious. Show up in Paulson at 11.15 am on May 12, find a seat, while leaving an empty seat next to you, and take the exam at Paulson. If you are taking it online, you will need to get on Brightspace, and the exam will show up on your page. (You will need an internet connection from 11.15 - 1.15 pm). At 11.15 am, you will be able to get into the exam, and you will take it on Brightspace, typing your answers directly into the box below the question (you cannot take pictures of hand written pages, since it creates a nightmare for me while grading.) The questions will look like exams on past finals, and will need you to work through to get to an answer, with partial credit. So, please show you work. If you put down just the answer, I will not give you any credit, even if it is the right answer.
(If you are entitled to extra time, and plan to take the exam online, please let me know)
What will it cover: Everything we have done in the class.
How do I prepare: Here you go (you’ve seen it before, but just in case):
Review session: https://youtu.be/XOCfyjEdg-k
Review session slides: http://www.stern.nyu.edu/~adamodar/pdfiles/cfexams/reviewFinalNew.pdf
You can try past final exams and check the solutions here:
Past final solutions: http://www.stern.nyu.edu/~adamodar/pdfiles/cfexams/cffinals.xlsx
|
||||||||||||||||||
| 5/7/25 | If you are taking the exam online tomorrow (or on May 12), I set up last year’s final exam as a trial exam for you to try. It may make sense for you to try this exam, and see how it feels answering the questions online (since you have to show steps to get to the answer). You may find having props like a calculation, pencil and a pad useful, but work it out yourself. Jacob Case took the trial exam and this is what he had to say:
I found that it helps if I set up extra space on a table or desk for my hand calculations and then I can easily sum up the numbers I am using. It is helpful to run through the practice as I know now how to better manage time as I was able to get through 4 problems in about 45 minutes which has me on time with doing 9 in 2 hours. Any advice I'd give others is to have enough space, calculator out and ready, and quickly summarize your variables and formulas/steps to show work in the text box.
|
||||||||||||||||||
| 5/9/25 | I know that you are busy preparing for the final exam, and I will not burden you with too long an email, but here are some final thoughts:
On a different note, the projects have all been graded and returned, with the scores recorded on Brightspace. I want to express my appreciation again for the work you put into the project, and if you feel that I have graded you unfairly, I am sorry! The grading ultimately was subjective, and I tried my best to capture what I saw in your project in your grade.
|
||||||||||||||||||
| 5/12/25 | I look forward to seeing you at the exam in Paulson at 11.15 am. If you are taking it online, you will be able to see the exam now but will not be able to open it until 11.15 am. Good luck! | ||||||||||||||||||
| 5/13/25 | Your final exams are graded, and you can pick them up at the usual place (if you did them physically) or check your answers (if you did them online). I have attached the solutions to both the May 8 (EarlyFinal) nine and the May 12 (physical and online versions) to this email. I am working on the final grades, and hope to have them in the next day or two. Attachments: Final Exam and Solution |
||||||||||||||||||
| 5/14/25 | The grades are officially in and you should be able to check them online soon, though there was a system glitch, where about 30 students had their grades randomly reassigned by a system genie (If you were on the list, you should have received an email from me already about the issue.). If you want to see how your scores translated into grades, put your scores into the attached excel spreadsheet (the scores in it already are for a hypothetical student, not you) and see how the grades were tabulated.
On a more general note, I want to thank you for the incredible amount of work you put into this class. I know that I buried you under emails (this is the 135th of the class), assignments, projects and weekly puzzles and I also know that most of you were unable to keep up. However, the material for the class will stay online and on YouTube for the foreseeable future. If you want to review parts of the class, please do go back and review the lecture, look through the notes and even try that week's puzzle. If you really, really want to master corporate finance, don't waste too much time reading books & papers or listening to lectures. Pick another company (preferably as different as you can get from your project company) and take it through the project analysis. Each time you repeat this process, it will not only get easier and more intuitive, but you will always learn something new. I still do!
I also want to thank Chris Ball and Zoey Cai, who were the teaching fellows for this class. I know that those of you who reached out to them for help found them to be constantly on call, and I could not have taught this class without them. In fact, if you had issues with this class, the fault is entirely mine, and they bear no responsibility for those issues. As you know, I am taking the next year off as a sabbatical, and rather than write books or make headlines, I plan to spend the year changing diapers and feeding my daughter’s baby (Vivian was born on May 6, 2025). I spent 2020, when my other granddaughter, Lily, was born, with her and her older brother, Noah, and it made my COVID year so much more fun! I am sorry that I will not be back to teach valuation to those of you who may still be up for the punishment next spring, but I plan to be back, rested and ready, in spring 2027 (by which time you should all have graduated and obtained incredibly lucrative jobs…)
Finally, in return for reading all (many, most, some) of my emails this semester, I have something to offer in return. If you have a question in corporate finance, valuation or investments, where you think I can be of use, you are welcome to always reach out to me. For the last time (at least for this class)! |
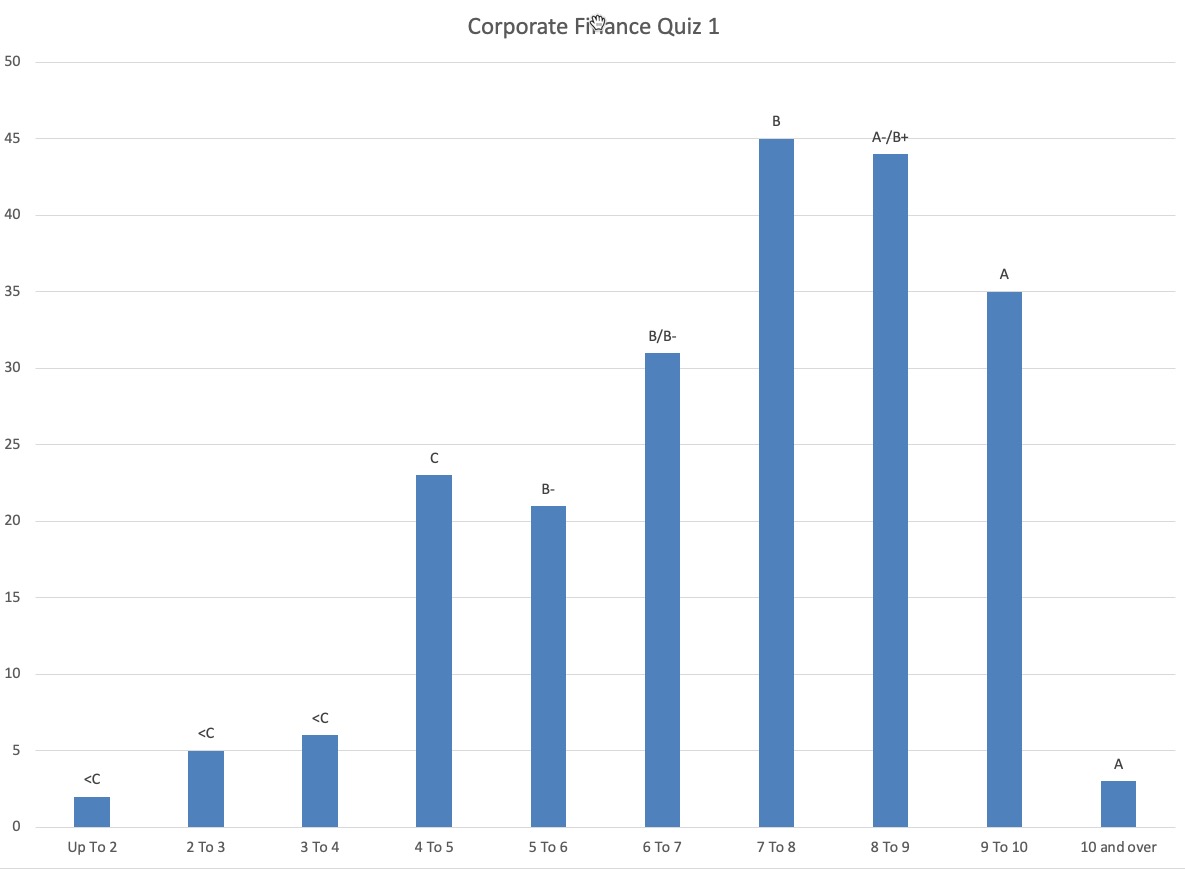